Fig. 5.
Download original image
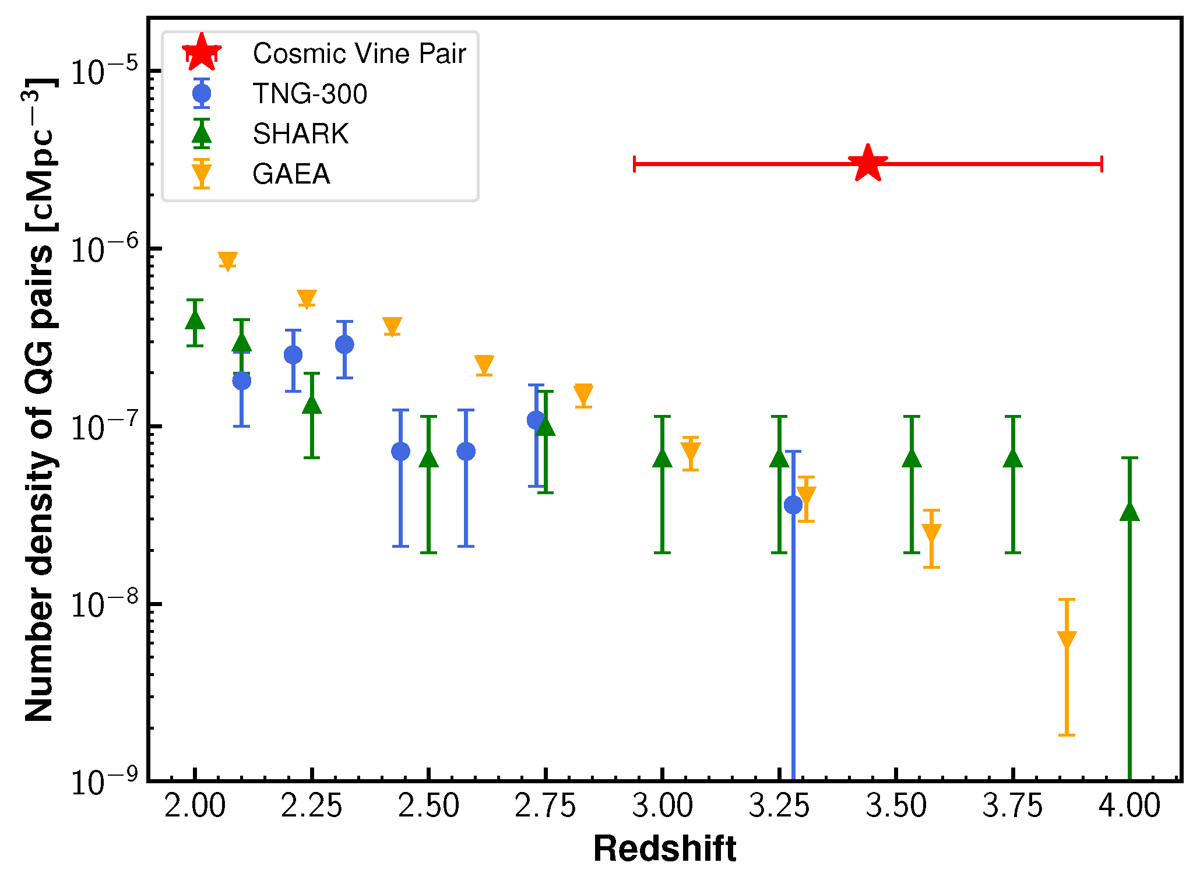
Number density of pairs of quiescent galaxies at each snapshot. Blue circles, green triangles, and yellow inverse triangles correspond to those of the TNG300, SHARK, and GAEA, respectively. Their error bar is determined based on the Poisson noise. The red star shows the observationally estimated number density from the CEERS survey volume. Its error bar along the x-axis is ±0.5 Gyr, which is the time used in deriving the number density.
Current usage metrics show cumulative count of Article Views (full-text article views including HTML views, PDF and ePub downloads, according to the available data) and Abstracts Views on Vision4Press platform.
Data correspond to usage on the plateform after 2015. The current usage metrics is available 48-96 hours after online publication and is updated daily on week days.
Initial download of the metrics may take a while.