Fig. 3.
Download original image
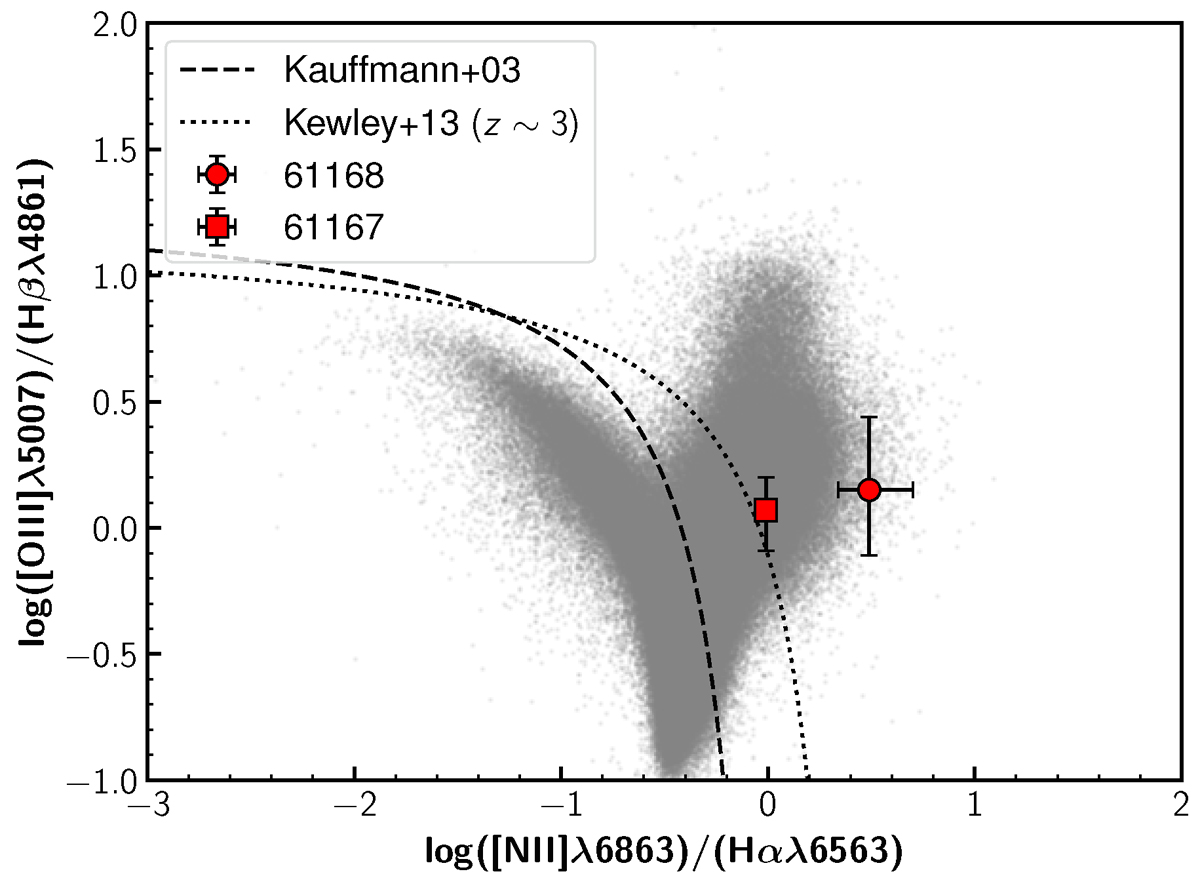
BPT (Baldwin et al. 1981) line ratio diagram. The pair members are shown as a red circle (61168) and a red square (61167), respectively. The lines separating the emission powered by star formation or AGN by Kauffmann et al. (2003) and Kewley et al. (2013) are shown as dashed and dotted lines, respectively. Gray dots indicate galaxies at z = 0 from the MPA-JHU SDSS catalog (Brinchmann et al. 2004; Kauffmann et al. 2003; Tremonti et al. 2004).
Current usage metrics show cumulative count of Article Views (full-text article views including HTML views, PDF and ePub downloads, according to the available data) and Abstracts Views on Vision4Press platform.
Data correspond to usage on the plateform after 2015. The current usage metrics is available 48-96 hours after online publication and is updated daily on week days.
Initial download of the metrics may take a while.