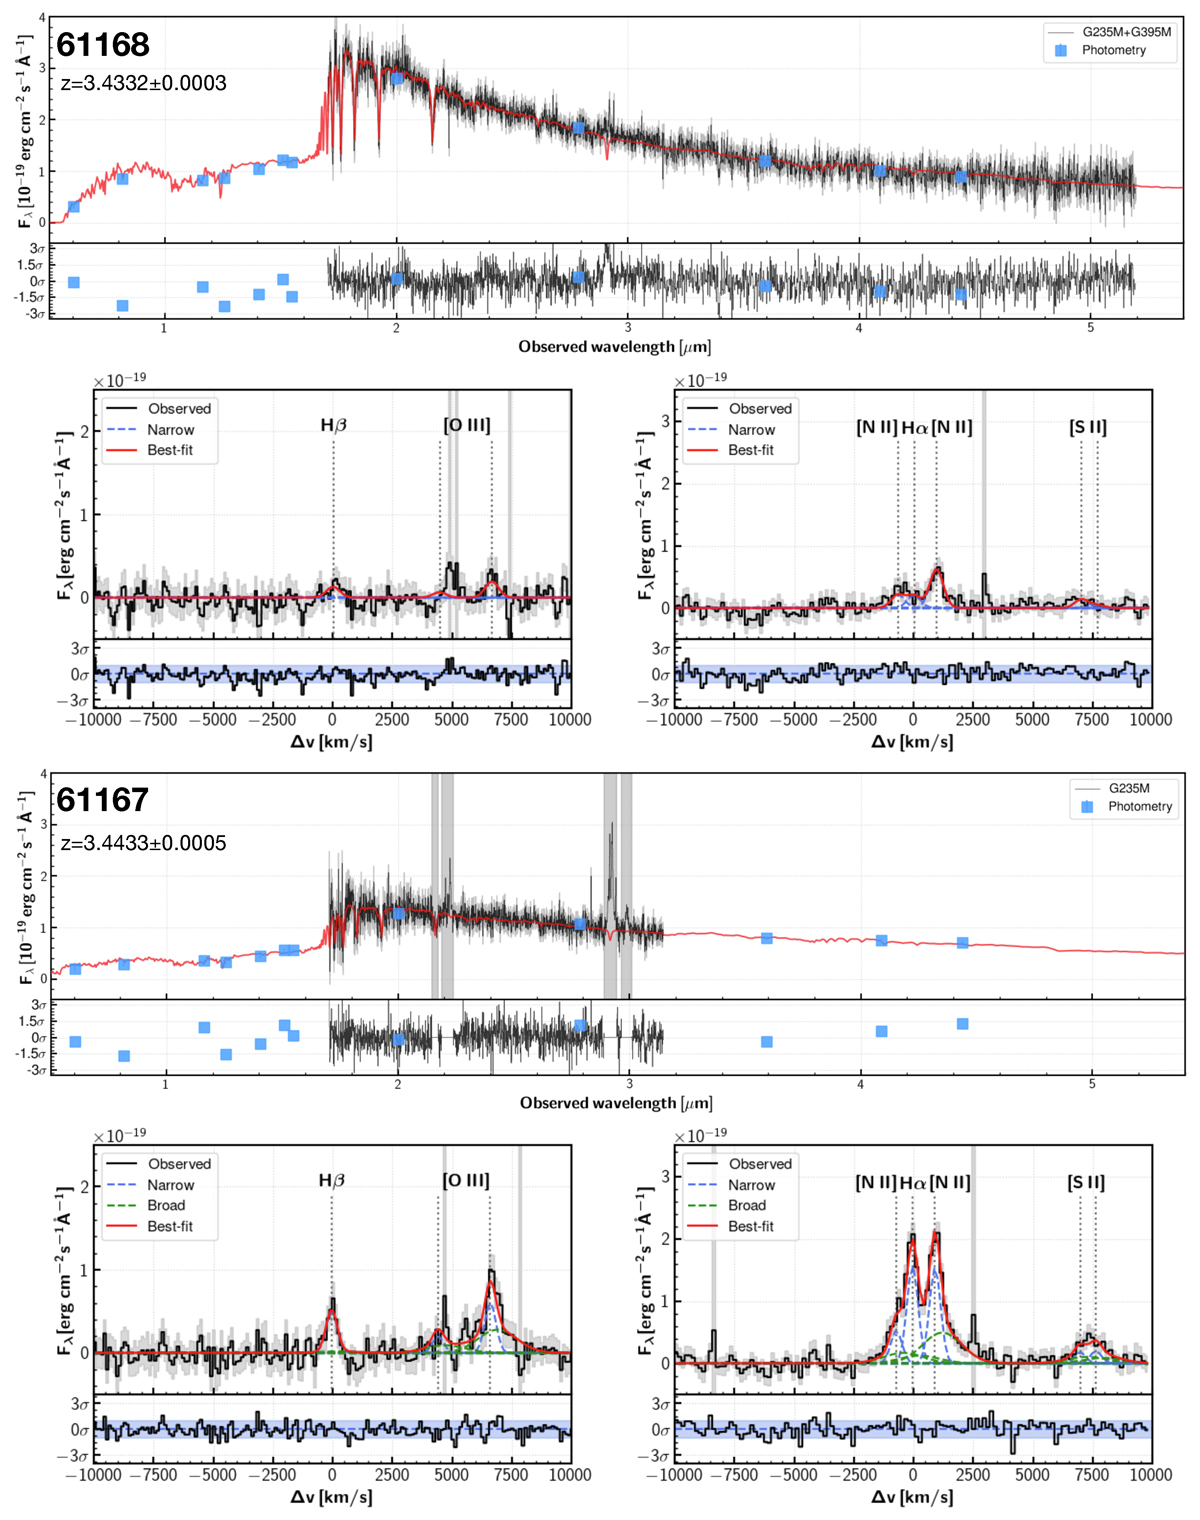
Fig. 2.
Download original image
Summary of spectra of two quiescent galaxies in the Cosmic Vine. The first two rows represent the spectrum of the 61168, and the latter two represent the 61167. For each galaxy, the upper panel shows the observed NIRSpec medium-resolution spectrum (black line), photometry (blue squares), and the best fit in SED fitting (red line). The gray hatch indicates the wavelength masked in the SED fitting. The bottom left panel shows the continuum-subtracted spectrum around the Hβ emission line. In addition to the observed spectrum (black) and best-fit spectrum (red), the narrow and broad components of the best-fit are shown in blue and green lines, respectively. The bottom right panel shows that around the Hα emission line. The meanings of the lines are identical to those of the bottom left panel. The difference between the observed spectrum and the best-fit model is shown at the bottom of each panel.
Current usage metrics show cumulative count of Article Views (full-text article views including HTML views, PDF and ePub downloads, according to the available data) and Abstracts Views on Vision4Press platform.
Data correspond to usage on the plateform after 2015. The current usage metrics is available 48-96 hours after online publication and is updated daily on week days.
Initial download of the metrics may take a while.