Fig. 9.
Download original image
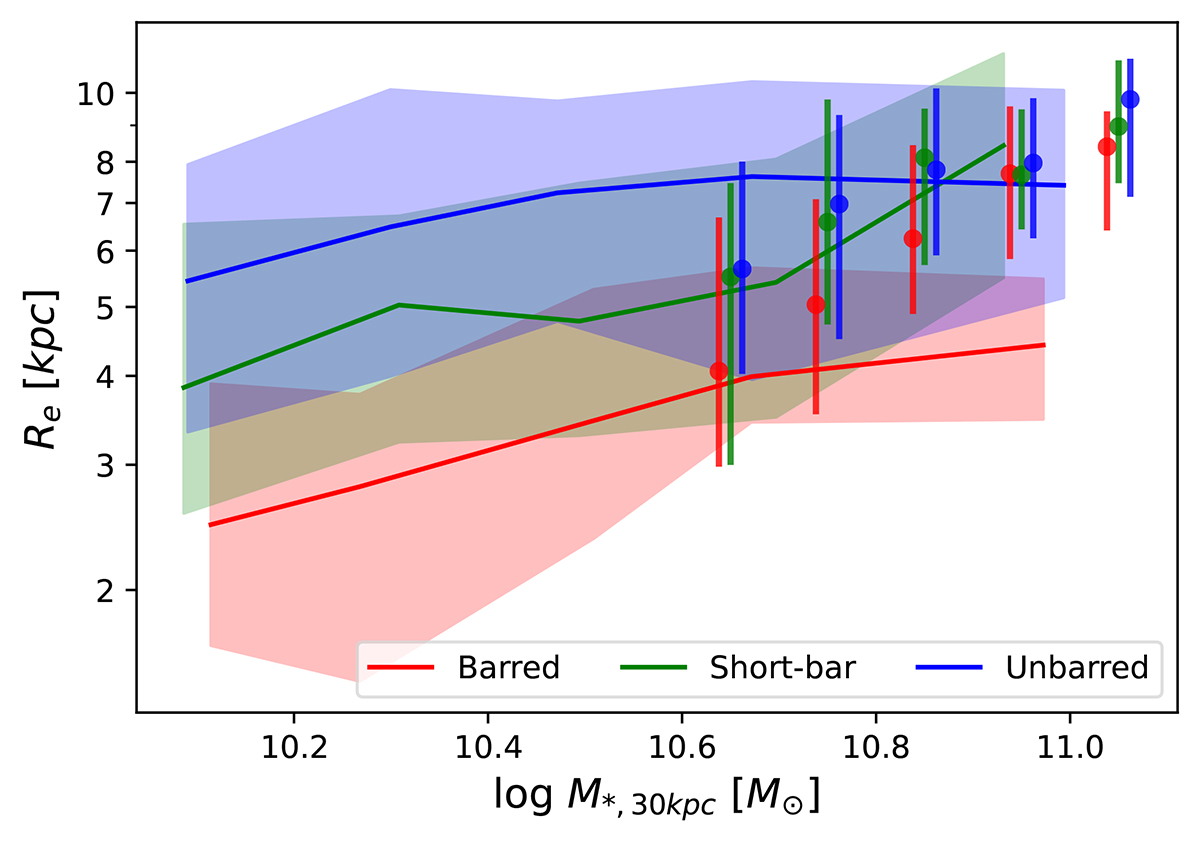
Variation of Re with the mass of the barred (red), short-bar (green), and unbarred (blue) galaxies at z = 0 in TNG50 (colored regions) and TNG100 (points with error bars). The solid lines and the points represent the median values, with colored regions and error bars indicating the range from the 16th to 84th percentile of each distribution.
Current usage metrics show cumulative count of Article Views (full-text article views including HTML views, PDF and ePub downloads, according to the available data) and Abstracts Views on Vision4Press platform.
Data correspond to usage on the plateform after 2015. The current usage metrics is available 48-96 hours after online publication and is updated daily on week days.
Initial download of the metrics may take a while.