Fig. 5.
Download original image
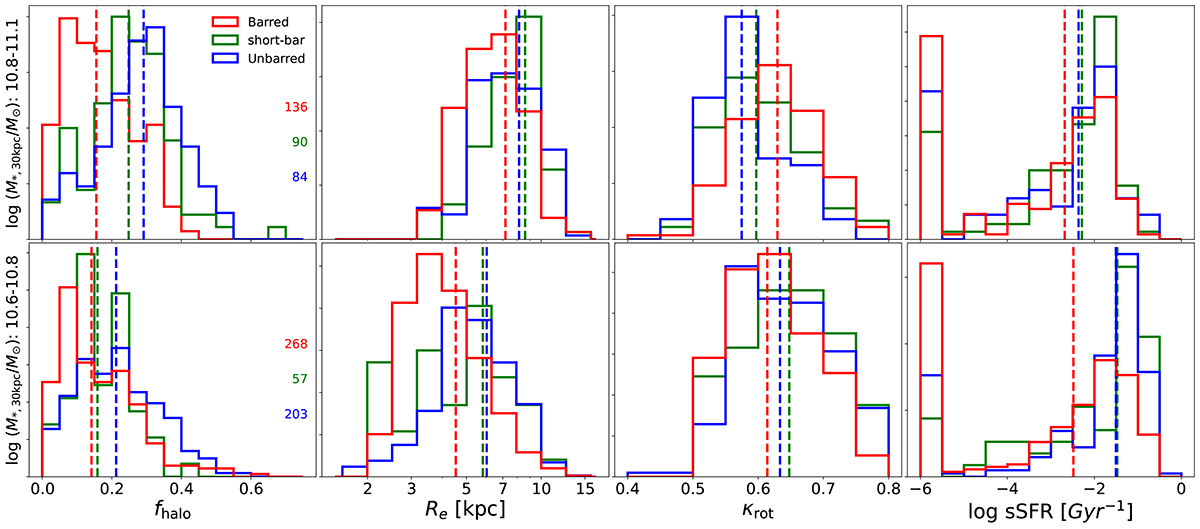
Distributions of fhalo, Re, κrot, and sSFR in barred (red), short-bar (green), and unbarred (blue) galaxies in TNG100. The lower and upper panels show relatively less massive and more massive galaxies, respectively. The dashed lines of the corresponding color indicate the median values. The numbers shown in the left column give the number of galaxies for the corresponding galaxy types and mass ranges.
Current usage metrics show cumulative count of Article Views (full-text article views including HTML views, PDF and ePub downloads, according to the available data) and Abstracts Views on Vision4Press platform.
Data correspond to usage on the plateform after 2015. The current usage metrics is available 48-96 hours after online publication and is updated daily on week days.
Initial download of the metrics may take a while.