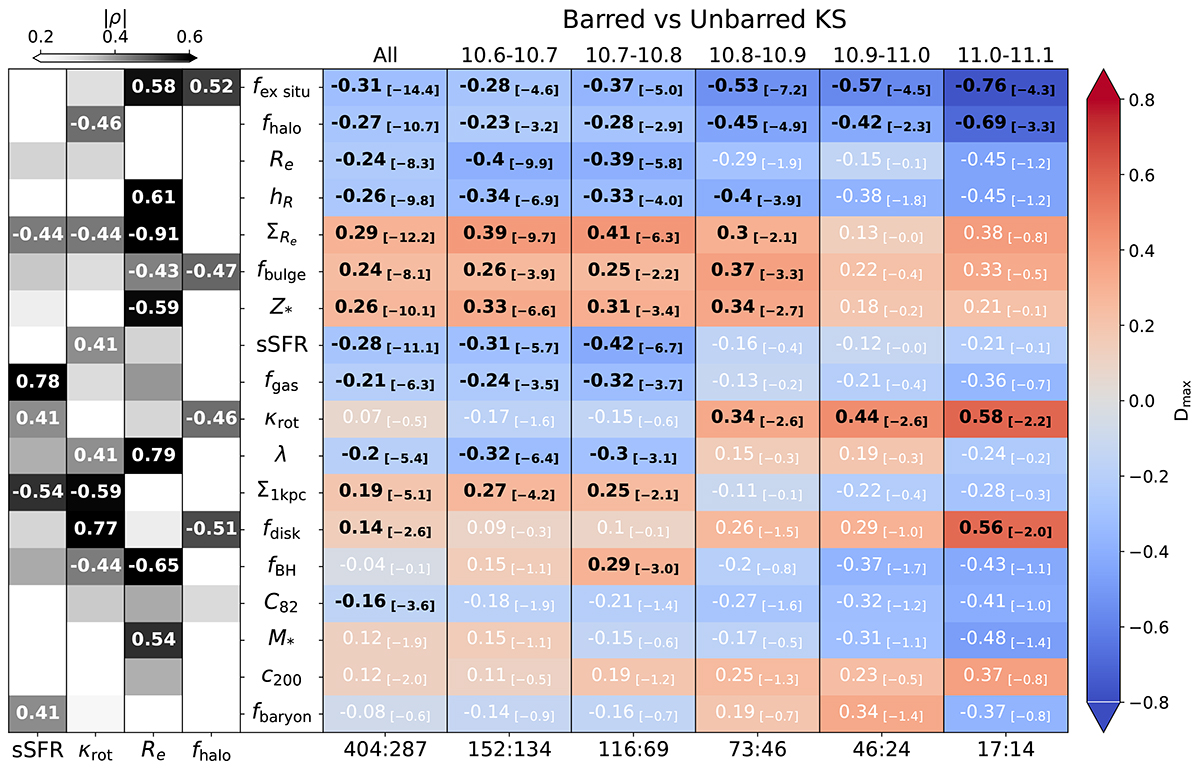
Fig. 4.
Download original image
Results of the KS test (right) and Pearson correlation coefficient (left) between various parameters of barred and unbarred galaxies. In the right part of the graph (in red or blue), the leftmost column represents the KS test for all samples, while the remaining five columns represent the KS-test results for samples in five different mass ranges. The two numbers at the bottom of each column give the sample sizes involved in the KS test, with the number on the left corresponding to the count of barred galaxies, and the number on the right to that of unbarred galaxies. Within each cell, the larger number on the left represents Dmax, the maximum distance between the two cumulative distribution functions of the two samples. A positive Dmax indicates barred galaxies have systematically larger corresponding parameter values, whereas a negative Dmax indicates the opposite. The smaller number in the bracket gives the log p-value. These numbers are highlighted in bold black when the p-values are less than 0.01, indicating significant differences. The ordering of parameters is obtained by the descending order of the sum of |Dmax| in all mass bins. In the left part of the figure (in blue), four columns show the Pearson correlation coefficients (ρ) between the four parameters (sSFR, κrot, Re, and fhalo) and all the parameters, the values on each cell being the corresponding ρ, labeled only for |ρ|> 0.4. The color on each cell is determined by |ρ|, with a darker color indicating a higher correlation between the two parameters. In the analysis here, these parameters are performed in the log space: Re, ΣRe, sSFR, SFR, fgas, λ*, Σ1 kpc, fBH, M*, and fbaryon.
Current usage metrics show cumulative count of Article Views (full-text article views including HTML views, PDF and ePub downloads, according to the available data) and Abstracts Views on Vision4Press platform.
Data correspond to usage on the plateform after 2015. The current usage metrics is available 48-96 hours after online publication and is updated daily on week days.
Initial download of the metrics may take a while.