Fig. 3.
Download original image
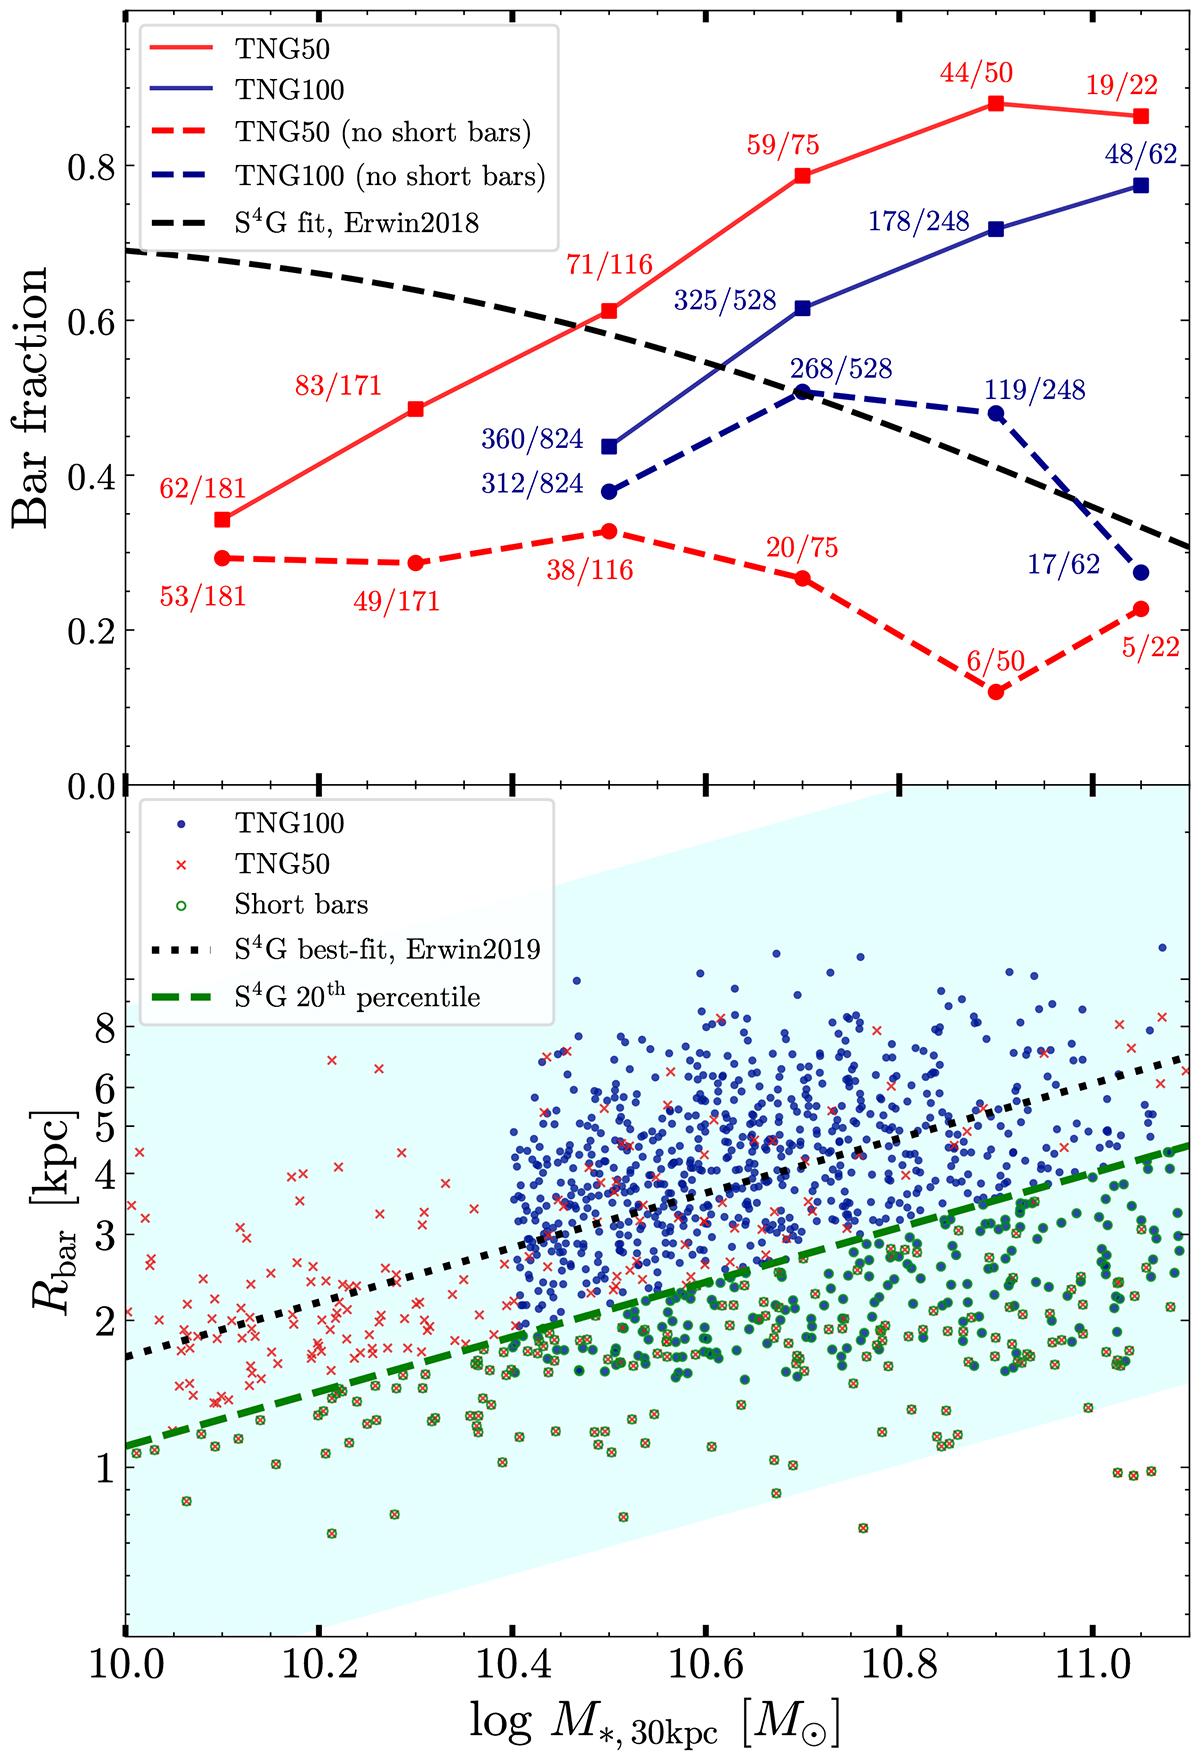
Variations of bar fraction, fbar, (upper) and distributions of bar size, Rbar, (lower) with stellar mass M*, 30 kpc for galaxies in TNG100 (blue) and TNG50 (red). In the bottom panel, the cyan shaded region represents the 3σ scatter range of bar sizes in the S4G survey (Erwin 2018). The black dotted line shows the best-fit relationship between bar size and stellar mass for the S4G sample (Erwin 2019). The green dashed lines indicates the 20th percentile of the bar size distribution derived from the S4G sample. Galaxies with short bars (bar sizes below the S4G 20th percentile) in TNG50 and TNG100 are highlighted with green circles. In the top panel, the solid and dashed lines show the bar fraction for all bars and bars longer than the S4G 20th percentile for TNG50 (red) and TNG100 (blue), respectively. The numbers next to the points indicate the number of barred galaxies over the total number of disk galaxies in each stellar mass bin for TNG50 and TNG100. Black line represent the fit of bar fractions observed in the near-infrared S4G survey (Erwin 2018).
Current usage metrics show cumulative count of Article Views (full-text article views including HTML views, PDF and ePub downloads, according to the available data) and Abstracts Views on Vision4Press platform.
Data correspond to usage on the plateform after 2015. The current usage metrics is available 48-96 hours after online publication and is updated daily on week days.
Initial download of the metrics may take a while.