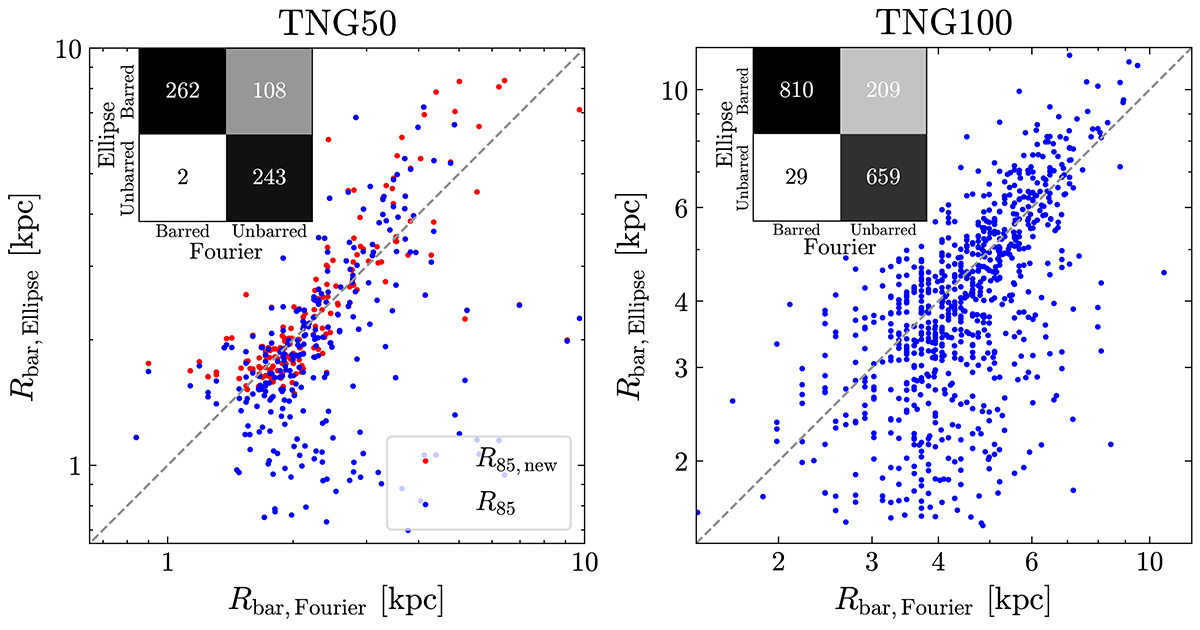
Fig. 2.
Download original image
Comparison of bar sizes measured by Fourier decomposition (x-axis) and ellipse fitting (y-axis) for TNG50 (left panel) and TNG100 (right panel). For TNG50, bar sizes obtained from ellipse fitting include the original R85 (blue points) and the adjusted R85, new (red points). The gray dashed lines represent the 1:1 reference lines in both panels. The confusion matrix in the top left corner of each panel compares the number of bars identified by Fourier decomposition and ellipse fitting. Points in the plot represent galaxies identified as barred by both methods.
Current usage metrics show cumulative count of Article Views (full-text article views including HTML views, PDF and ePub downloads, according to the available data) and Abstracts Views on Vision4Press platform.
Data correspond to usage on the plateform after 2015. The current usage metrics is available 48-96 hours after online publication and is updated daily on week days.
Initial download of the metrics may take a while.