Open Access
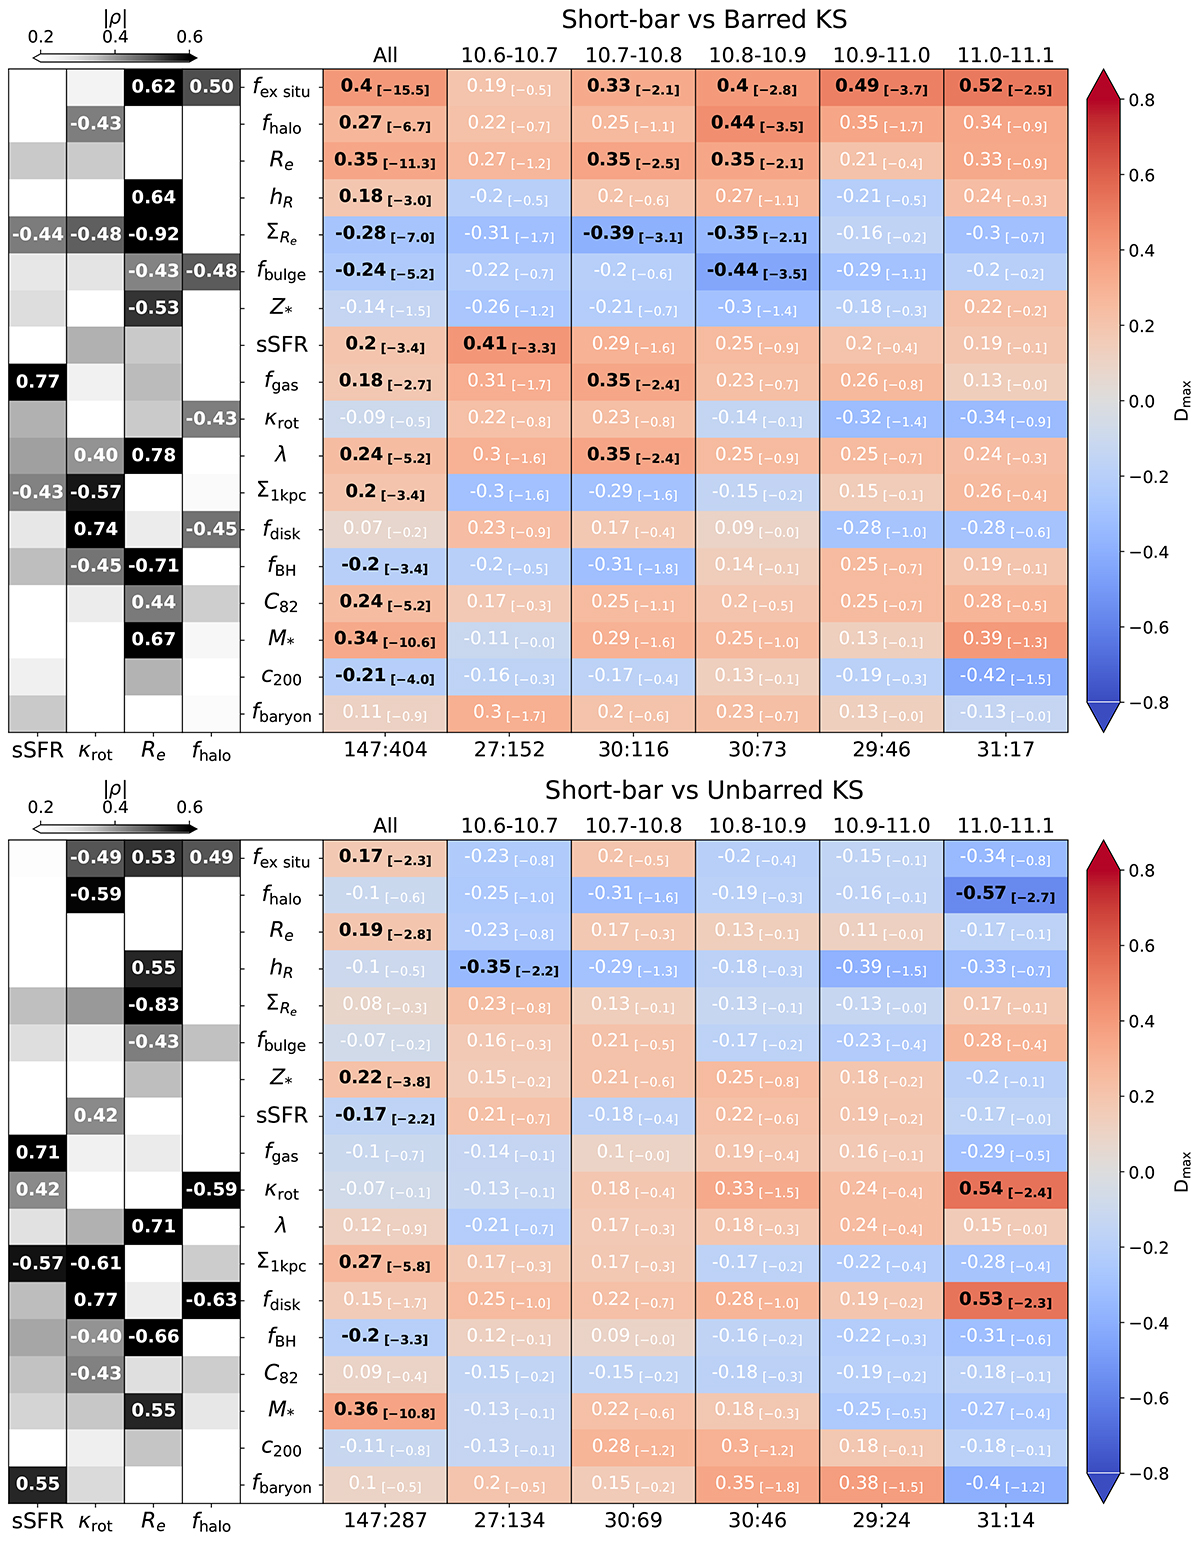
Fig. B.1.
Download original image
Similar to Fig 4, this figure presents KS test results of TNG100 galaxies: the top panel shows the comparison between short-bar and barred galaxies, and the bottom panel shows results between short-bar and unbarred galaxies.
Current usage metrics show cumulative count of Article Views (full-text article views including HTML views, PDF and ePub downloads, according to the available data) and Abstracts Views on Vision4Press platform.
Data correspond to usage on the plateform after 2015. The current usage metrics is available 48-96 hours after online publication and is updated daily on week days.
Initial download of the metrics may take a while.