Fig. 14.
Download original image
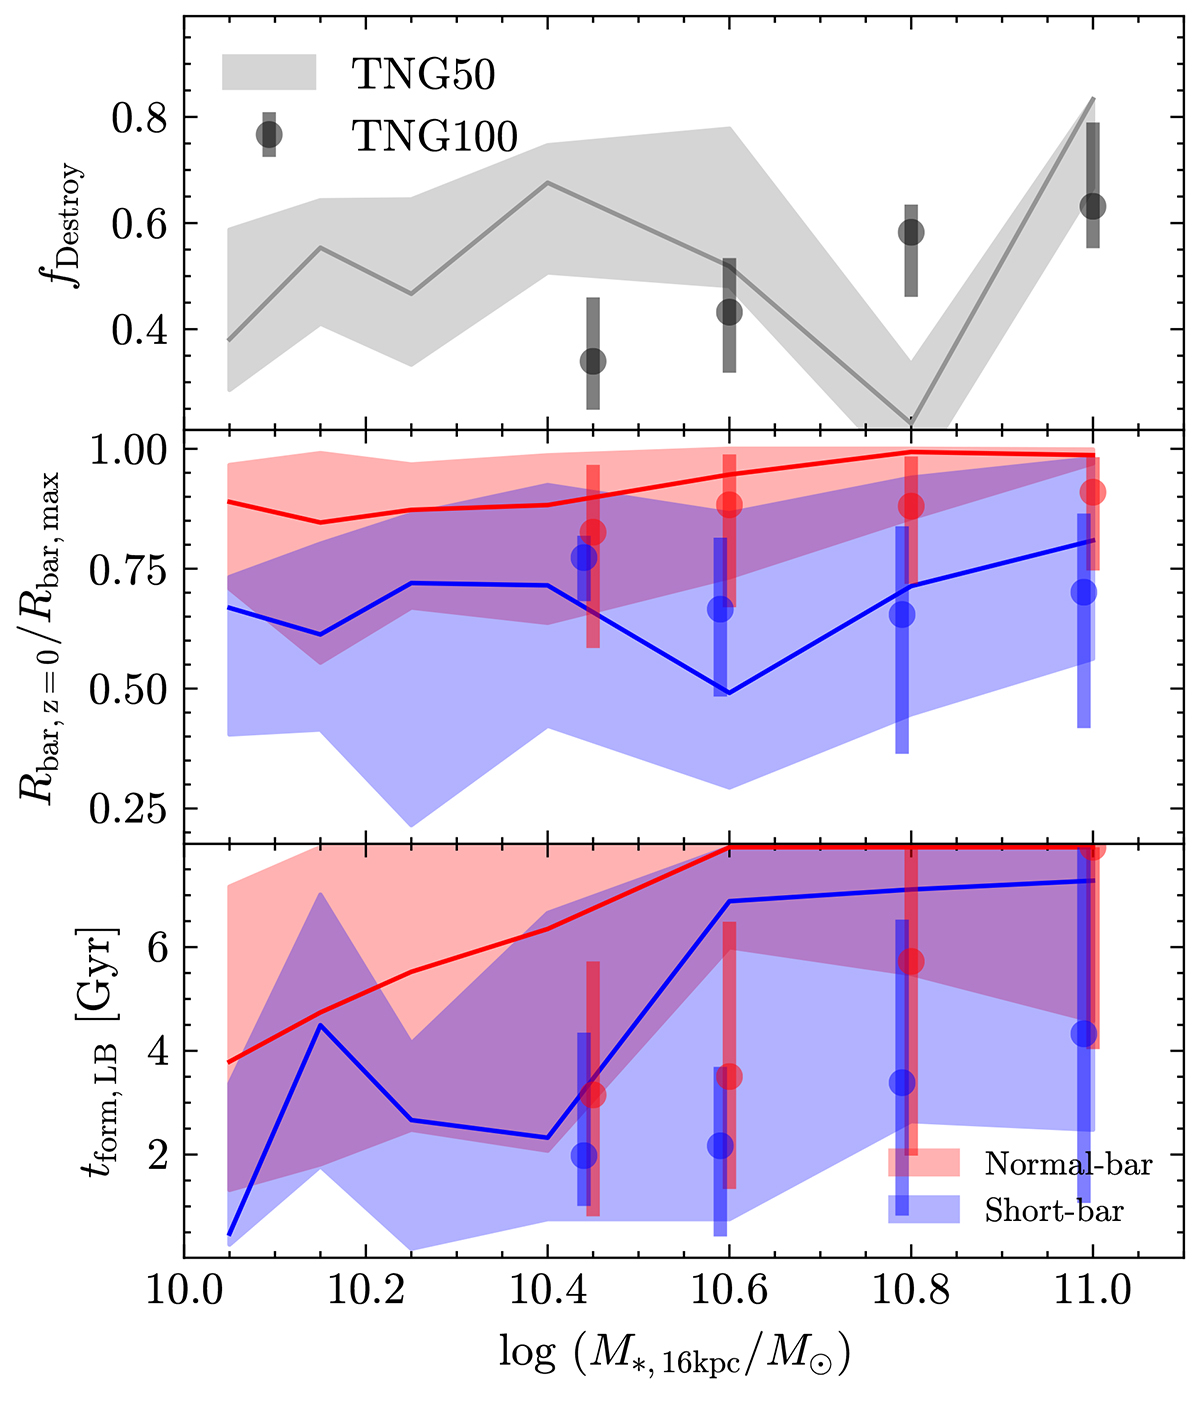
Evolutionary features of bars as a function of galaxy stellar mass. TNG100 galaxies are shown by points with error bars. And the shaded regions correspond to TNG50 galaxies. The top panel shows the ratio of unbarred galaxies fDestroy at z = 0 that previously had a bar. The middle panel shows the ratio of the bar size between z = 0 and its maximum size throughout the galaxy’s history Rbar, z = 0/Rbar, max. The bottom panel illustrates the bar formation time in lookback time tform, LB as a function of galaxy mass. For the middle and bottom panels, the points and solid lines represent the median values, and the error bars and shaded envelopes show the 16–84th percentile distributions. Regarding the bottom panel, for galaxies with masses greater than 1010.6 M⊙, many bars had already formed by a lookback time of 8 Gyr. In the top panel, the error bars and shaded regions stand for variations resulting from different definitions of bar presence.
Current usage metrics show cumulative count of Article Views (full-text article views including HTML views, PDF and ePub downloads, according to the available data) and Abstracts Views on Vision4Press platform.
Data correspond to usage on the plateform after 2015. The current usage metrics is available 48-96 hours after online publication and is updated daily on week days.
Initial download of the metrics may take a while.