Fig. 13.
Download original image
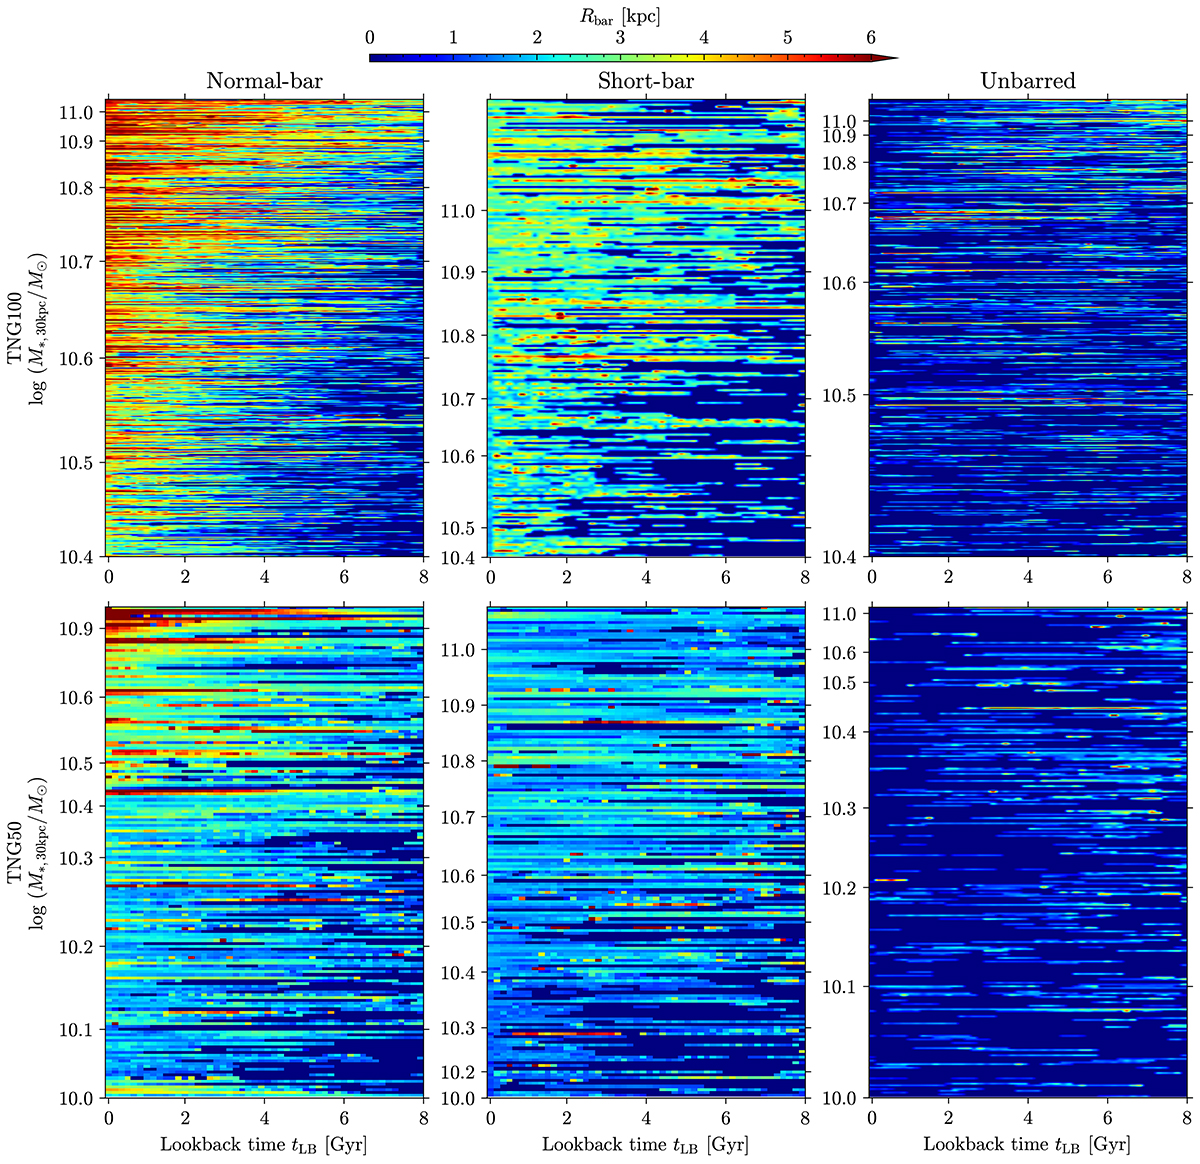
Evolutionary history of bar size (color) for barred (left column), short-bar (middle column), and unbarred (right column) galaxies in TNG100 (top row) and TNG50 (bottom row). Each row of one panel represents the bar size of an individual galaxy as a function of lookback time (tLB). Galaxies in each panel are ranked by stellar mass.
Current usage metrics show cumulative count of Article Views (full-text article views including HTML views, PDF and ePub downloads, according to the available data) and Abstracts Views on Vision4Press platform.
Data correspond to usage on the plateform after 2015. The current usage metrics is available 48-96 hours after online publication and is updated daily on week days.
Initial download of the metrics may take a while.