Fig. 11.
Download original image
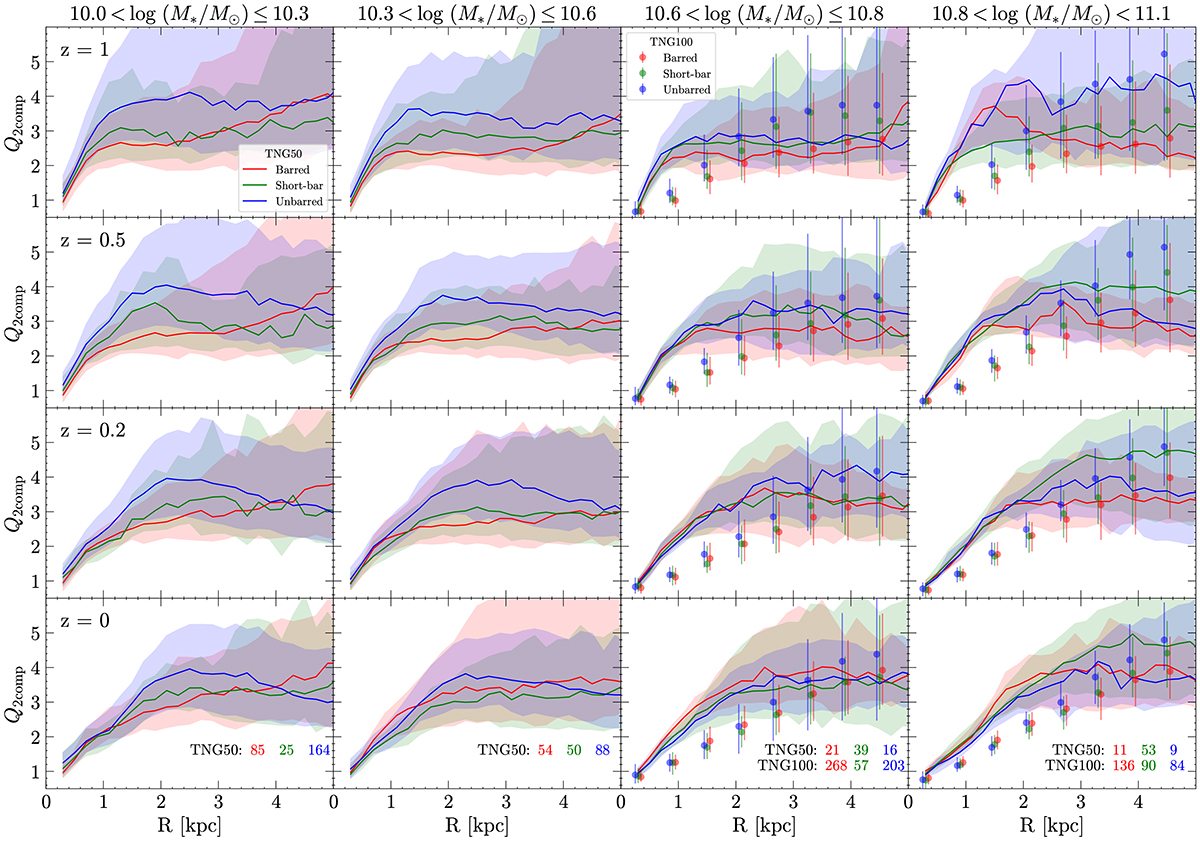
Evolution of the radial profiles of two-component disk stability parameter (Q2comp) for barred (red), short-bar (green), and unbarred (blue) galaxies across four mass ranges from z = 1 (top) to z = 0 (bottom) in TNG50 (colored region). The columns from left to right, show the changes over cosmic time within four mass ranges shown at the top of each column. TNG100 galaxies (points with error bars) are overlaid in the mass bins with log (M*/M⊙) = 10.6 − 10.8 and log (M*/M⊙) = 10.8 − 11.1 (right two columns). The solid curves and points represent the median values, while the colored regions and error bars give the range from the 16th to the 84th percentiles of each Q2comp distribution. The numbers in the bottom panels are the number count of galaxies in each sample.
Current usage metrics show cumulative count of Article Views (full-text article views including HTML views, PDF and ePub downloads, according to the available data) and Abstracts Views on Vision4Press platform.
Data correspond to usage on the plateform after 2015. The current usage metrics is available 48-96 hours after online publication and is updated daily on week days.
Initial download of the metrics may take a while.