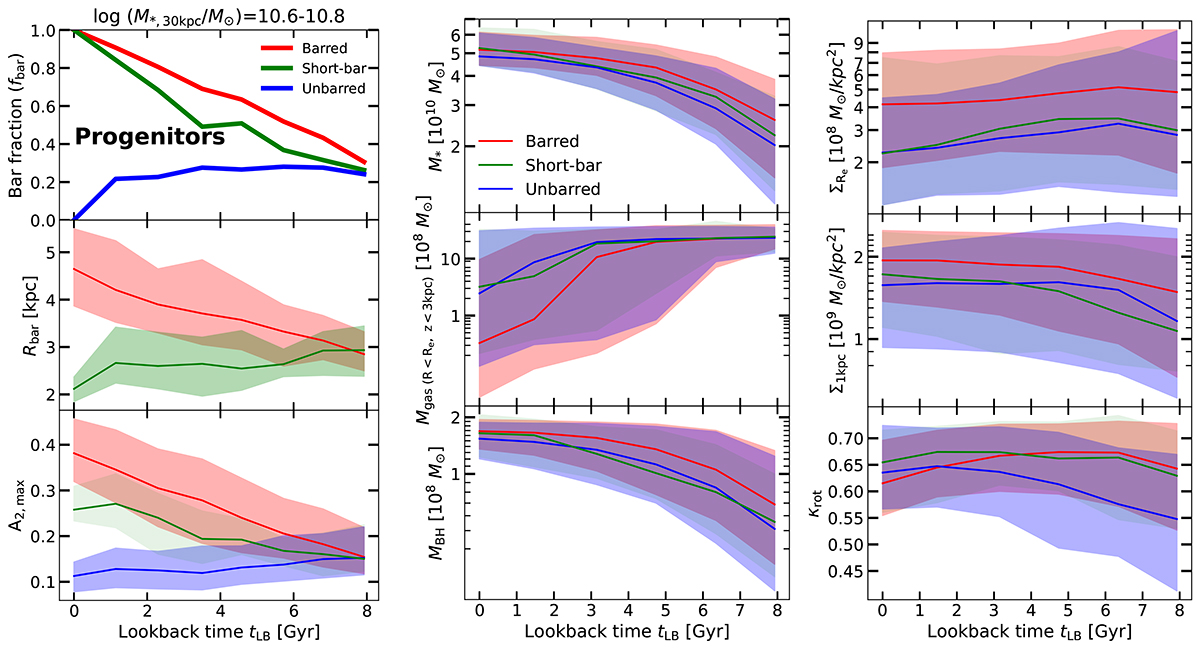
Fig. 10.
Download original image
Evolution of the bar characteristics (left column) in relatively less massive barred (red), short-bar (green), and unbarred (blue) galaxies with log (M*, 30 kpc/M⊙) = 10.6 − 10.8 in TNG100 and the evolution of some parameters of the galaxies (middle and right columns). The left column displays the evolution of the bar size (Rbar) obtained from ellipse fitting (middle panel) and the evolution of bar fraction for the sample of galaxies based (top panel). It also presents the evolution of A2, max obtained from Fourier decomposition (bottom panel). The middle column shows the evolution of stellar mass (M*), central gas mass (Mgas), and supermassive black hole mass (MBH). The right column shows the evolution of the stellar surface mass density within Re (ΣRe), the central 1 kpc stellar surface mass density (Σ1 kpc) and the ratio of kinetic energy over ordered rotation (κrot). For all the panels, the x-axis is lookback time, which equals z = 0 when lookback time = 0 Gyr, and z = 1 when lookback time ≈ 8 Gyr. The solid lines represent the median values of each distribution, with colored regions indicating the 16–84th percentile range.
Current usage metrics show cumulative count of Article Views (full-text article views including HTML views, PDF and ePub downloads, according to the available data) and Abstracts Views on Vision4Press platform.
Data correspond to usage on the plateform after 2015. The current usage metrics is available 48-96 hours after online publication and is updated daily on week days.
Initial download of the metrics may take a while.