Fig. 1.
Download original image
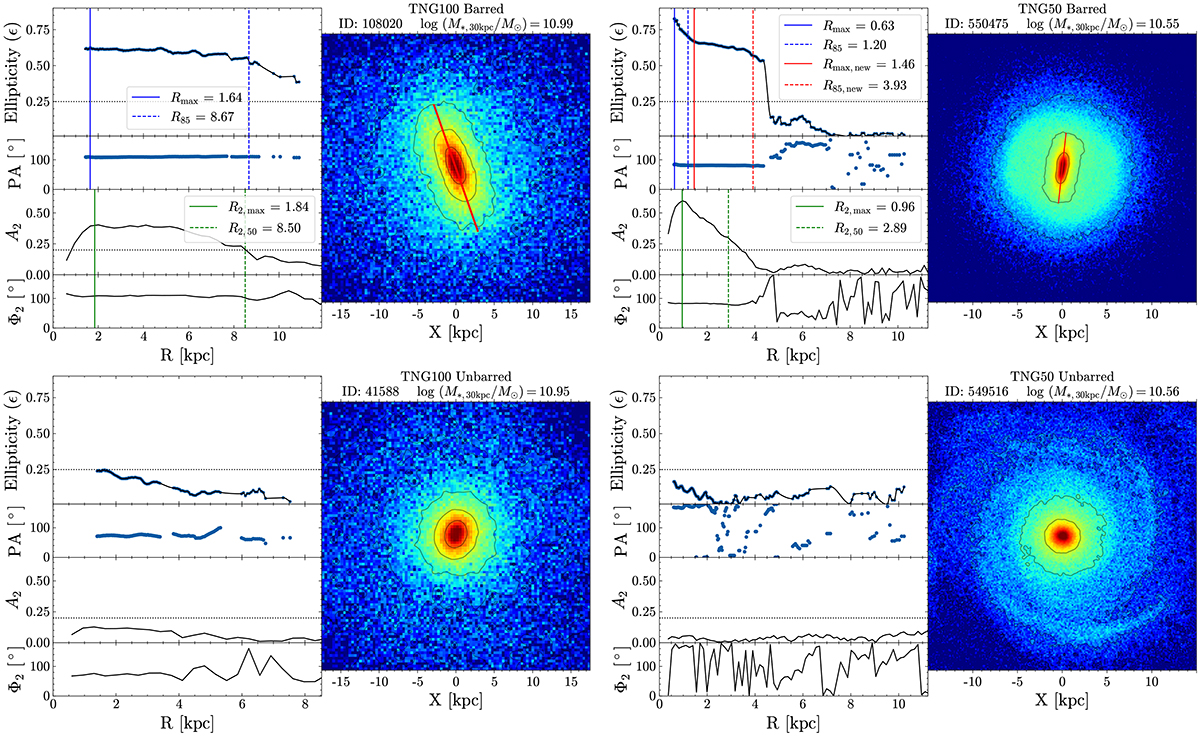
Examples of ellipse fitting and Fourier decomposition of barred galaxies (top row) and unbarred galaxies (bottom row) in TNG100 (left) and TNG50 (right). The right-hand column in each panel displays the face-on stellar surface density maps of the galaxies, with each pixel corresponding to 0.35 × 0.35 kpc2 for TNG100, and 0.15 × 0.15 kpc2 for TNG50. The left-hand column of each galaxy presents the radial profiles of ellipticity (ϵ) and position angle (PA) measured via ellipse fitting, along with A2 and Φ2 from Fourier decomposition. Horizontal dotted lines at ϵ = 0.25 and A2 = 0.2 are included for reference in each panel. For the barred galaxies: the blue solid and dashed lines represent Rmax and R85, respectively; for TNG50, the adjusted measurements Rmax, new and R85, new, calculated with an inner boundary limit of 1.4 kpc, are shown in red; the green solid and dashed line represent R2, max and R2, 50, respectively; in the stellar surface density maps, the red line represents the bar size measured by R85 for TNG100 and R85, new for TNG50.
Current usage metrics show cumulative count of Article Views (full-text article views including HTML views, PDF and ePub downloads, according to the available data) and Abstracts Views on Vision4Press platform.
Data correspond to usage on the plateform after 2015. The current usage metrics is available 48-96 hours after online publication and is updated daily on week days.
Initial download of the metrics may take a while.