Open Access
Fig. 3
Download original image
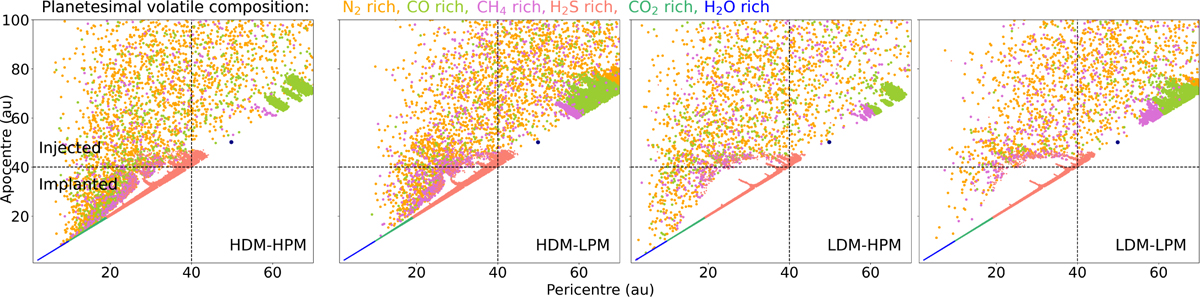
Same as Fig. 2 with the excited planetesimals being colour–coded according to the compositional region they originate from. This compositional gradient is based on HD 163296’s temperature profile and on the condensation temperatures as ices of the main volatile molecules.
Current usage metrics show cumulative count of Article Views (full-text article views including HTML views, PDF and ePub downloads, according to the available data) and Abstracts Views on Vision4Press platform.
Data correspond to usage on the plateform after 2015. The current usage metrics is available 48-96 hours after online publication and is updated daily on week days.
Initial download of the metrics may take a while.