Fig. 7.
Download original image
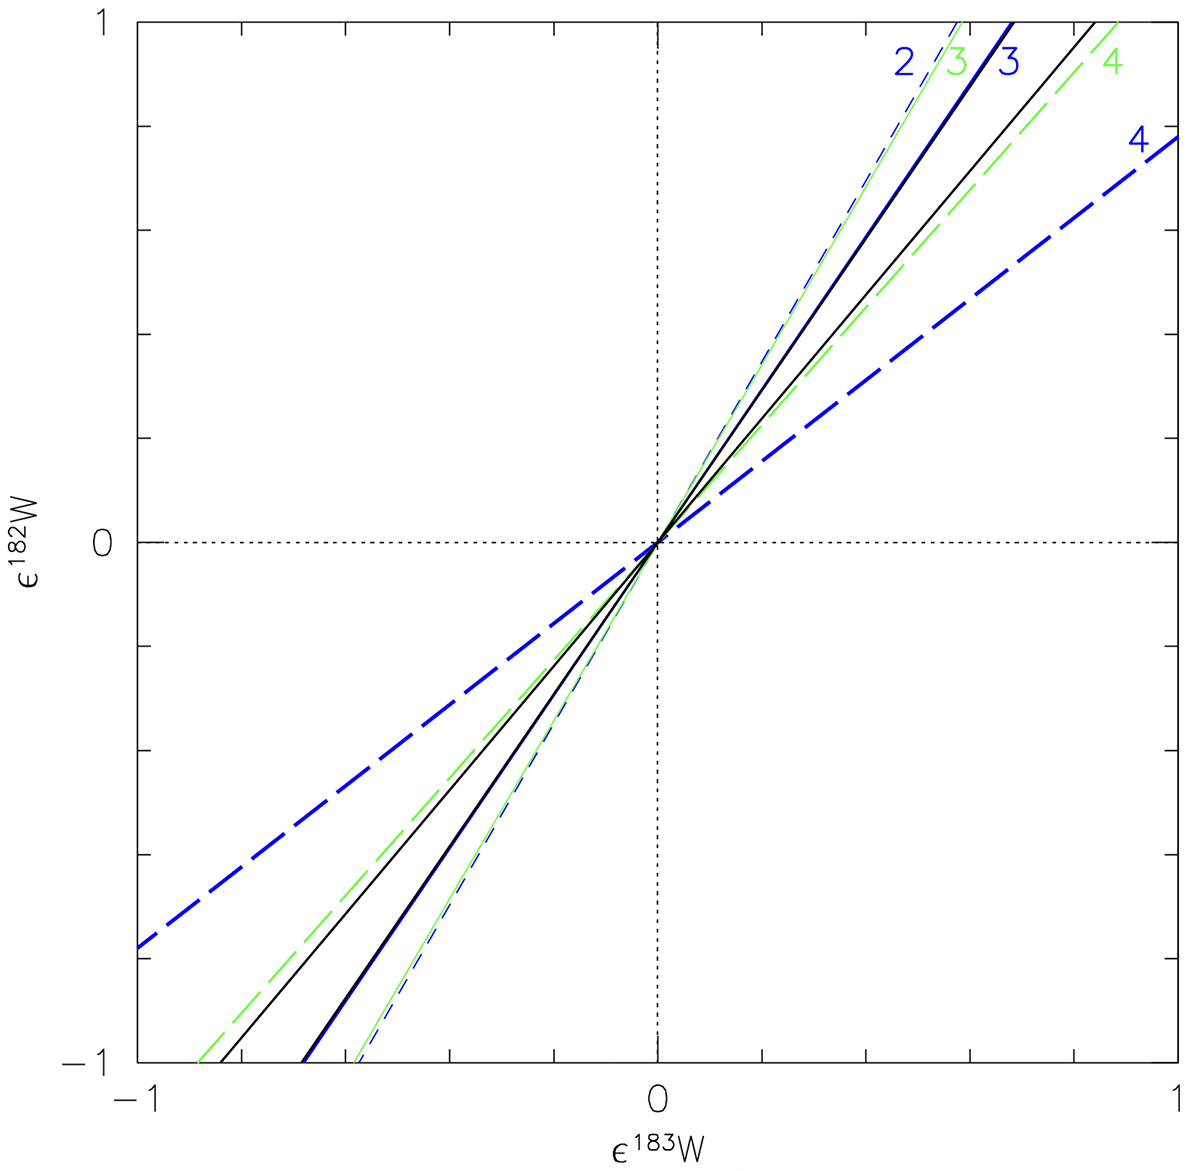
Linear correlations between ϵ182W (including the 182Hf abundance) and ϵ183W (i.e. ratios internally normalised to 186W/184W and relative to the solar ratios, multiplied by 10 000) derived from the lowest and the upper limit of the observations (solid black lines) and from the abundances calculated at the end of the evolution of Set 2 models of Z = 0.014 (blue lines) and Z = 0.03 (green lines), with stellar mass indicated by corresponding labels and different line types: 2 M⊙ (short-dashed), 3 M⊙ (solid), and 4 M⊙ (long-dashed). We note that the M = 3 M⊙Z = 0.014 line overlaps with the line of the observational upper limit. The dotted lines indicate the solar composition. Addition of s-process material produces negative values, while removal correspond to positive values.
Current usage metrics show cumulative count of Article Views (full-text article views including HTML views, PDF and ePub downloads, according to the available data) and Abstracts Views on Vision4Press platform.
Data correspond to usage on the plateform after 2015. The current usage metrics is available 48-96 hours after online publication and is updated daily on week days.
Initial download of the metrics may take a while.