Fig. 6.

Download original image
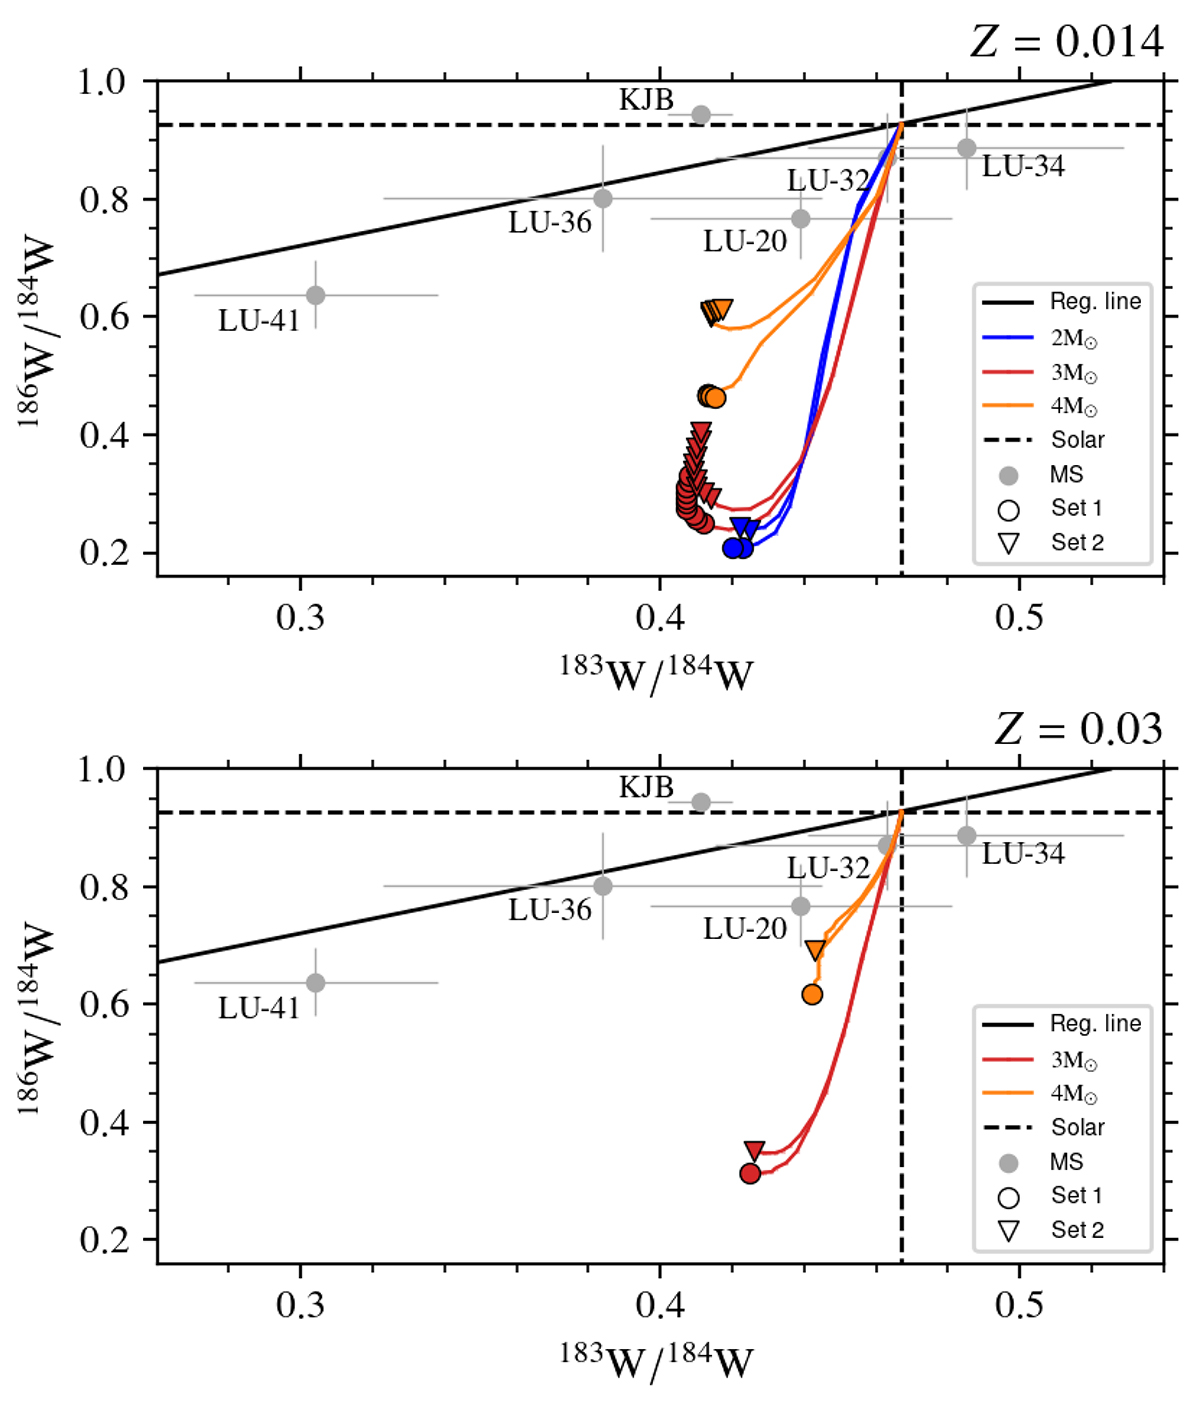
186W/184W vs 183W/184W from single large grains (LU) and the average of small grains (KJB, dark grey circles with 1σ error bars from Ávila et al. 2012) compared to the surface evolution of Set 1 and Set 2 stellar models of solar (top panel) and of double-solar metallicity (bottom panel) of different masses (see legend). Circles (Set 0) and triangles (Set 2) on the lines represent the composition after each TDU after the envelope becomes C-rich. The dashed black lines represent the solar composition (δ = 0 by definition). The solid black line is the regression line from Ávila et al. (2012).
Current usage metrics show cumulative count of Article Views (full-text article views including HTML views, PDF and ePub downloads, according to the available data) and Abstracts Views on Vision4Press platform.
Data correspond to usage on the plateform after 2015. The current usage metrics is available 48-96 hours after online publication and is updated daily on week days.
Initial download of the metrics may take a while.


