Fig. 4.
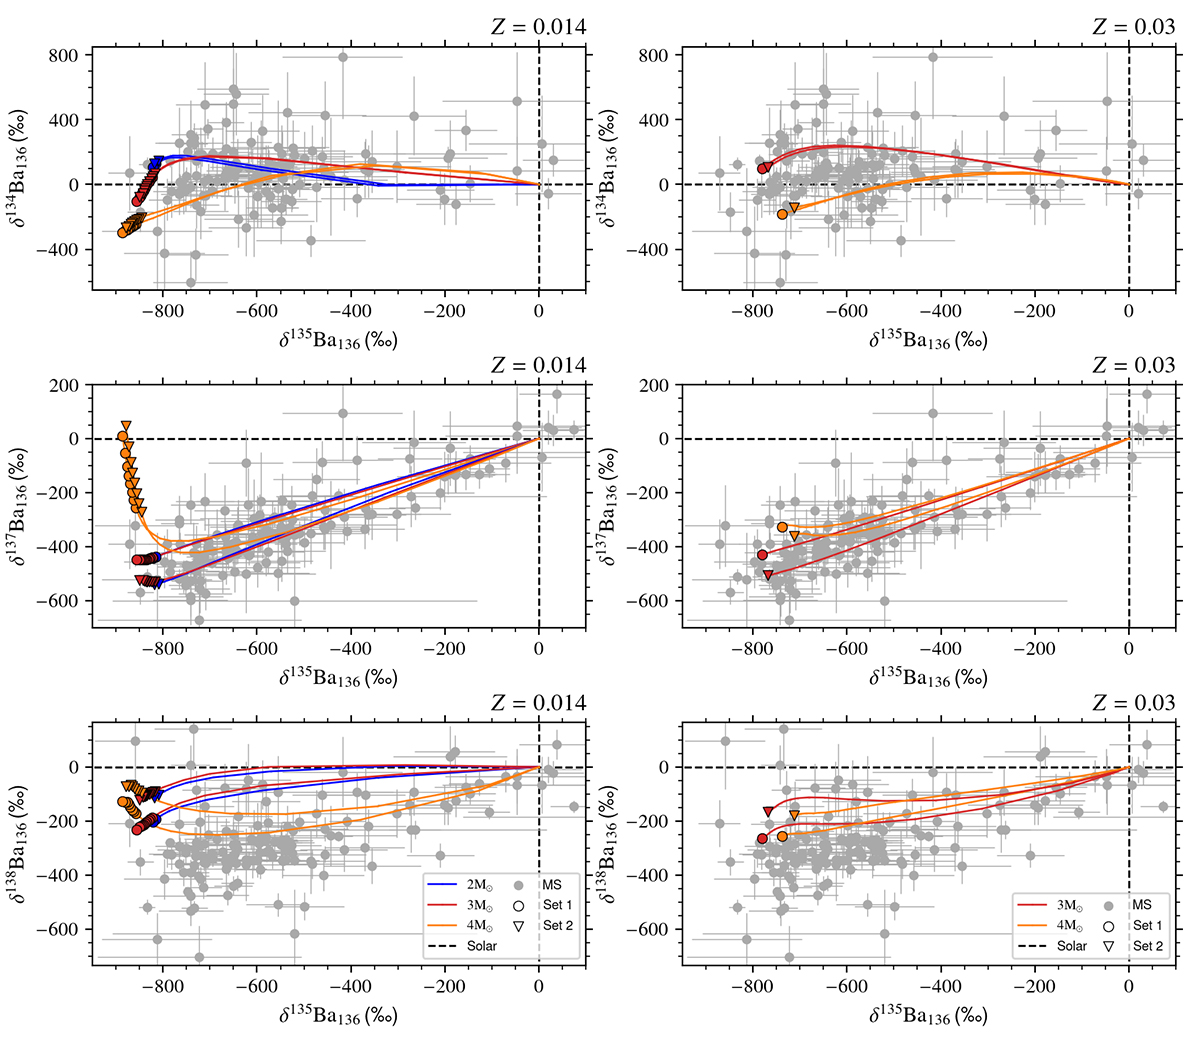
Download original image
δ134Ba136 (top row), δ137Ba136 (middle row), and δ138Ba136 (bottom row) vs δ135Ba136 from mainstream SiC grain data (dark grey circles with 1σ error bars from Savina et al. 2003; Barzyk 2007; Marhas et al. 2007; Liu et al. 2014, 2015, 2017a,b, 2019, 2022; Stephan et al. 2018, 2019) compared to the surface evolution of Set 1 and Set 2 stellar models of solar (left panels) and of double-solar metallicity (right panels) of different masses (see legend). Circles (Set 1) and triangles (Set 2) on the lines represent the composition after each TDU after the envelope becomes C-rich. The dashed black lines represent the solar composition (δ = 0 by definition).
Current usage metrics show cumulative count of Article Views (full-text article views including HTML views, PDF and ePub downloads, according to the available data) and Abstracts Views on Vision4Press platform.
Data correspond to usage on the plateform after 2015. The current usage metrics is available 48-96 hours after online publication and is updated daily on week days.
Initial download of the metrics may take a while.