Fig. 4
Download original image
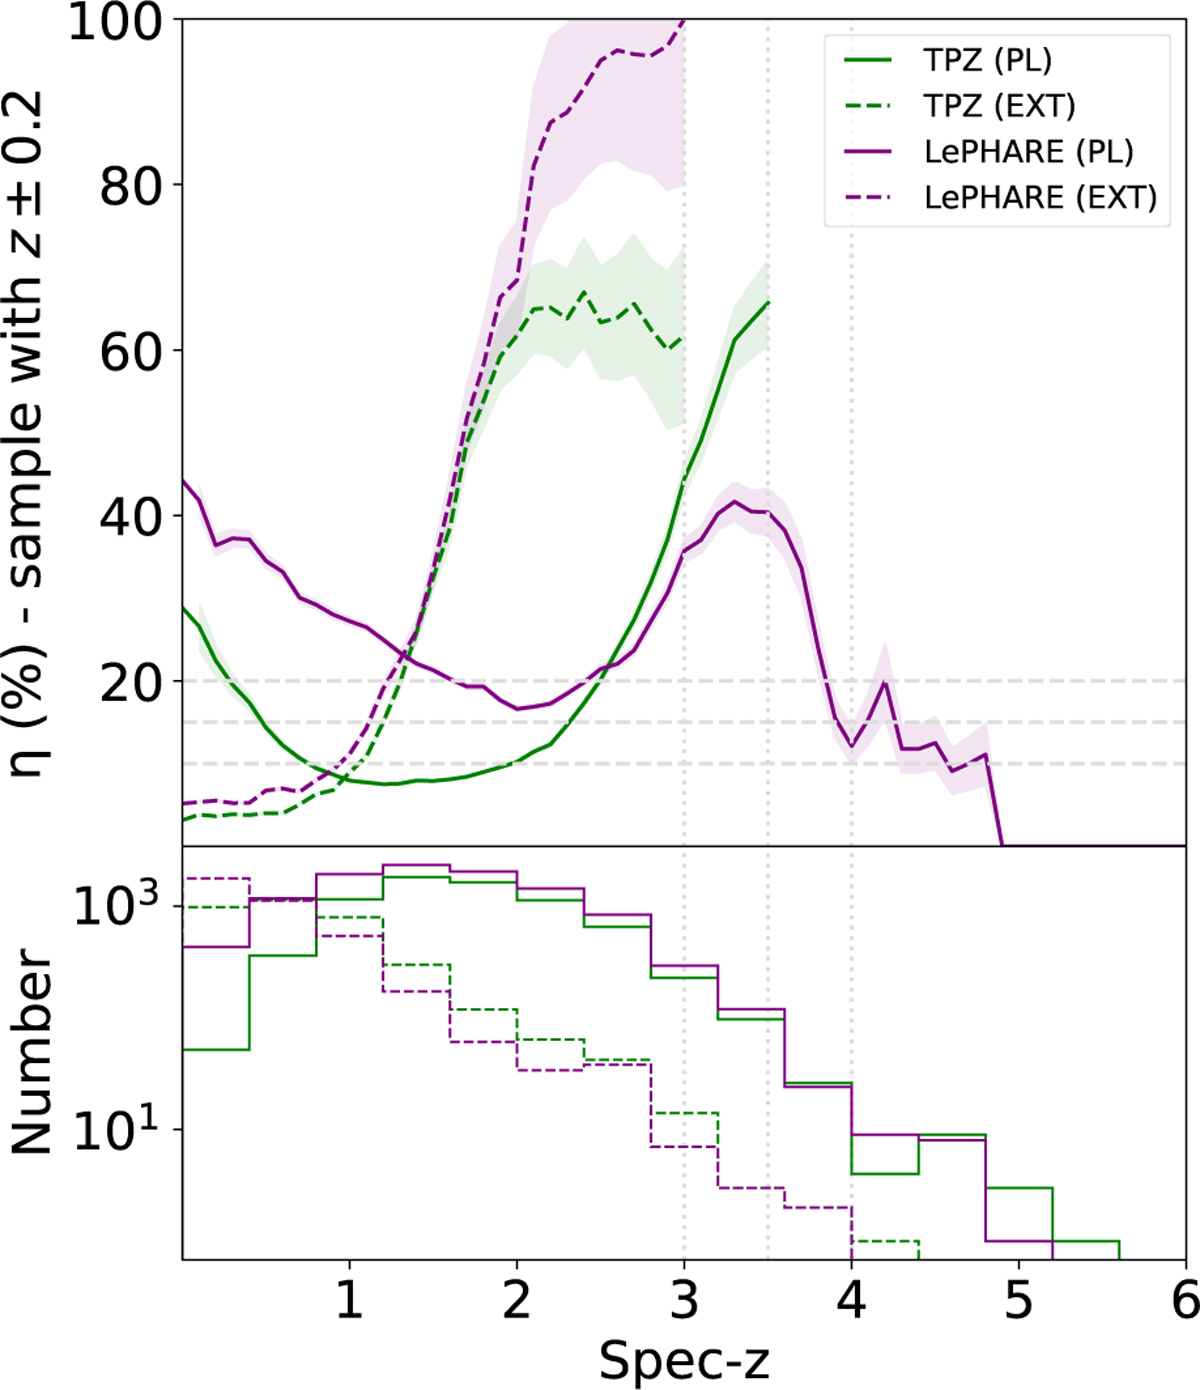
Percentage of outliers versus spectroscopic redshift (upper panel). The solid (dashed) lines correspond to point-like (extended) sources for the TPZ (green) and LePHARE (purple) results. Shaded regions represent the uncertainty in the percentage of outliers at each spec-z bin, calculated as the percentage of outliers divided by ![]() , where N is the number of sources in each bin. Larger sample sizes result in narrower shaded regions. The bottom panel shows the distribution of the training sample with spectroscopic redshifts in each case.
, where N is the number of sources in each bin. Larger sample sizes result in narrower shaded regions. The bottom panel shows the distribution of the training sample with spectroscopic redshifts in each case.
Current usage metrics show cumulative count of Article Views (full-text article views including HTML views, PDF and ePub downloads, according to the available data) and Abstracts Views on Vision4Press platform.
Data correspond to usage on the plateform after 2015. The current usage metrics is available 48-96 hours after online publication and is updated daily on week days.
Initial download of the metrics may take a while.