Fig. 17
Download original image
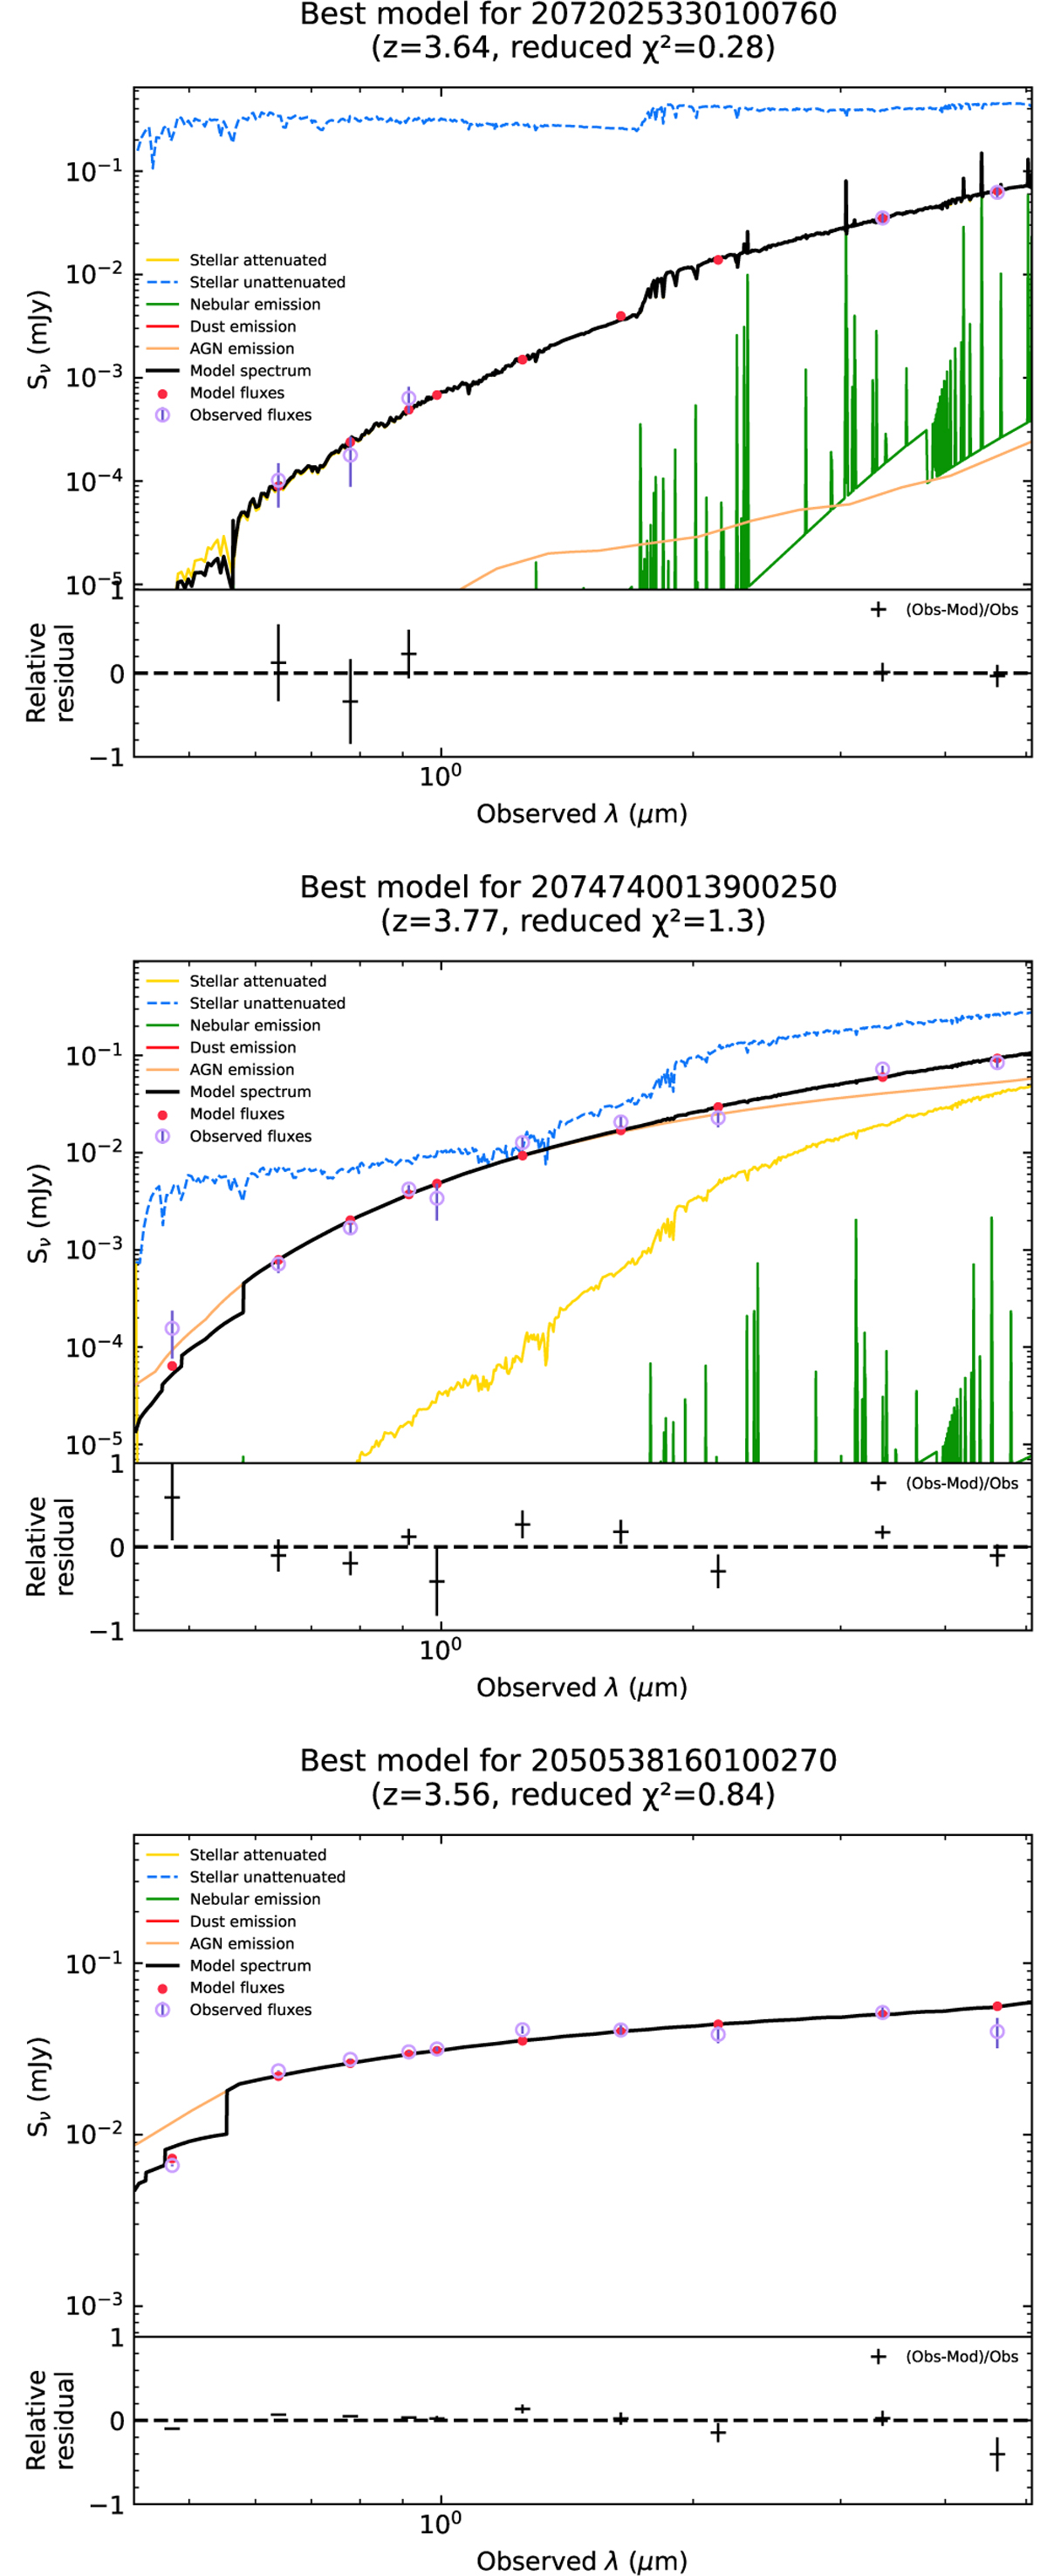
Example SED fits of an X-ray absorbed AGN (top), an X-ray unabsorbed AGN (middle), and an optically selected QSO (bottom). The dust emission is plotted in red, the AGN component in orange, the attenuated (unattenuated) stellar component is shown with the yellow (blue) solid (dashed) line, while the green lines shows the nebular emission. The total flux is represented with black colour. Below each SED, we plot the relative residual fluxes versus the wavelength.
Current usage metrics show cumulative count of Article Views (full-text article views including HTML views, PDF and ePub downloads, according to the available data) and Abstracts Views on Vision4Press platform.
Data correspond to usage on the plateform after 2015. The current usage metrics is available 48-96 hours after online publication and is updated daily on week days.
Initial download of the metrics may take a while.