Fig. 14
Download original image
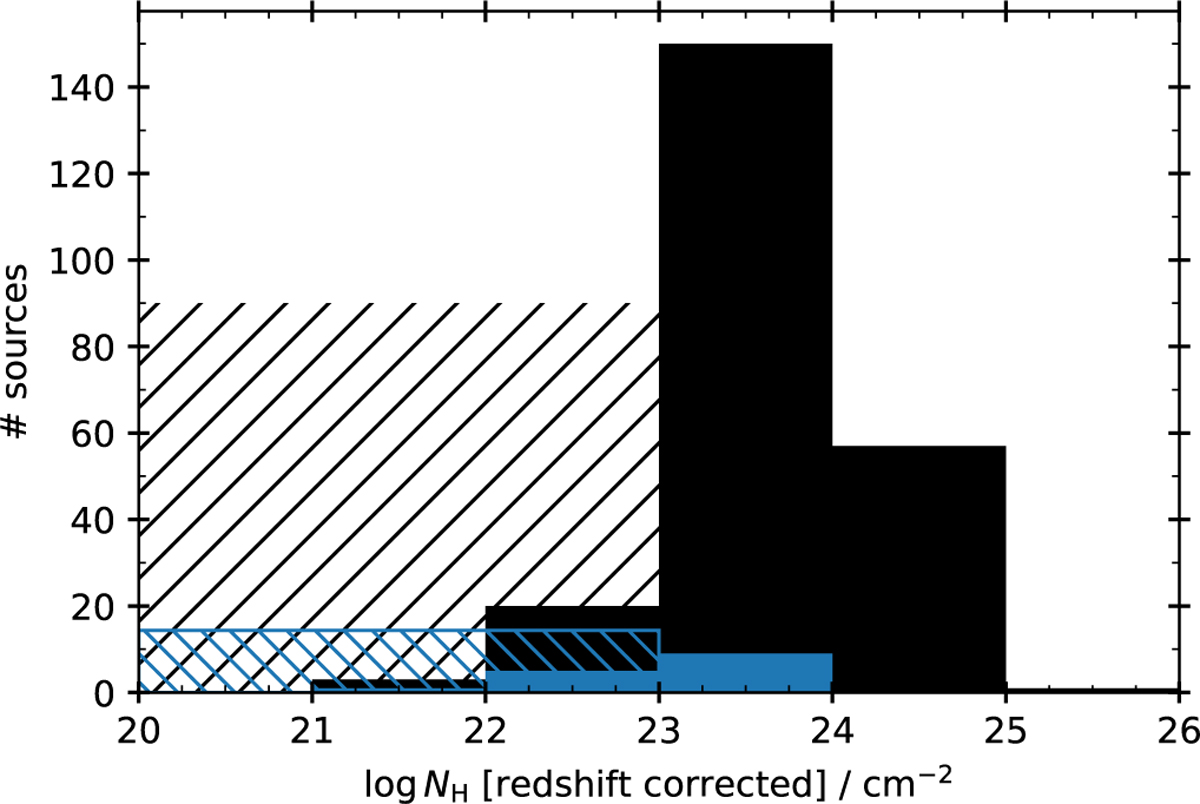
Estimated distribution of the rest-frame Hydrogen column density for our high-z sample. The black, solid histogram corresponds to sources with a significant observed NH (i.e. above the Galactic value) and corrected to rest-frame values. The hatched histogram shows our estimated number of unabsorbed sources. The blue histogram shows the corresponding distributions for the optically selected QSO by Yang & Shen (2023) included in our sample.
Current usage metrics show cumulative count of Article Views (full-text article views including HTML views, PDF and ePub downloads, according to the available data) and Abstracts Views on Vision4Press platform.
Data correspond to usage on the plateform after 2015. The current usage metrics is available 48-96 hours after online publication and is updated daily on week days.
Initial download of the metrics may take a while.