Fig. 10
Download original image
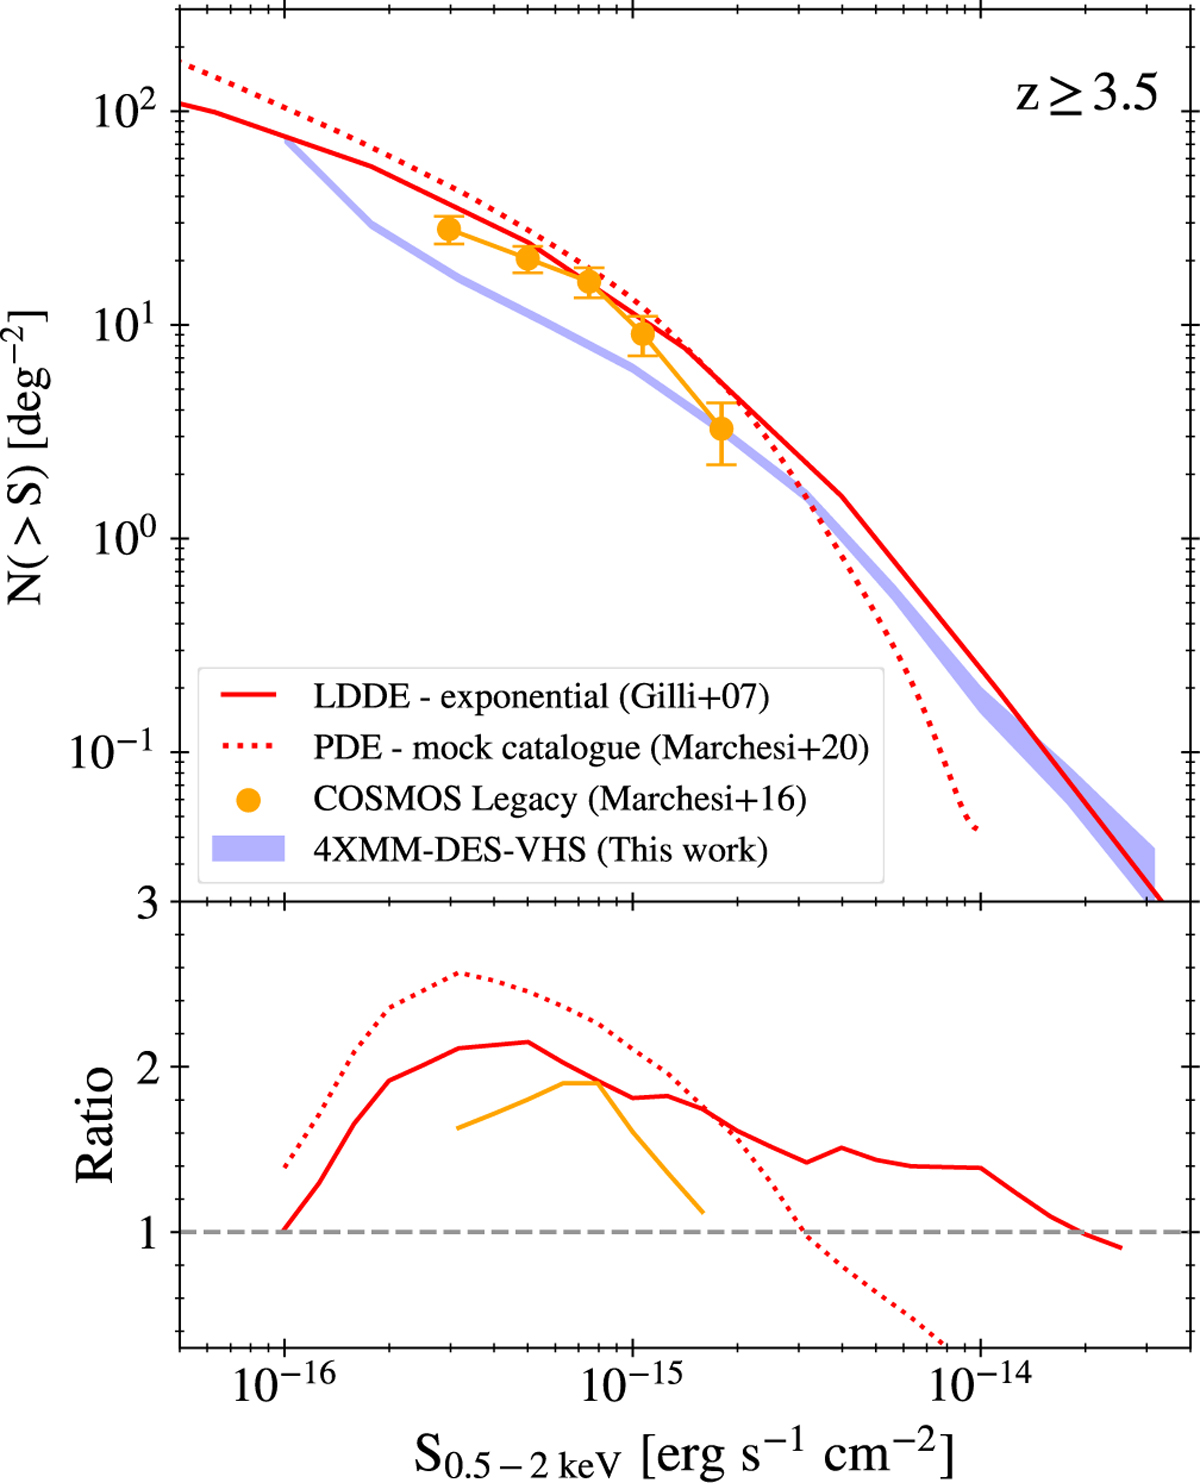
Cumulative number counts for the high-z sample in the redshift bin z ⩾ 3.5 (upper panel). The shaded blue area represent the 1σ uncertainties in our measurements. The solid line indicates the LDDE model predictions with an exponential decline by Gilli et al. (2007), while the dotted line shows the mock catalogue of Marchesi et al. (2020) based on the XLF by Vito et al. (2014). For reference, we include the data points derived by Marchesi et al. (2016b). The lower panel presents the ratio between our data and the different models.
Current usage metrics show cumulative count of Article Views (full-text article views including HTML views, PDF and ePub downloads, according to the available data) and Abstracts Views on Vision4Press platform.
Data correspond to usage on the plateform after 2015. The current usage metrics is available 48-96 hours after online publication and is updated daily on week days.
Initial download of the metrics may take a while.