Fig. 9.
Download original image
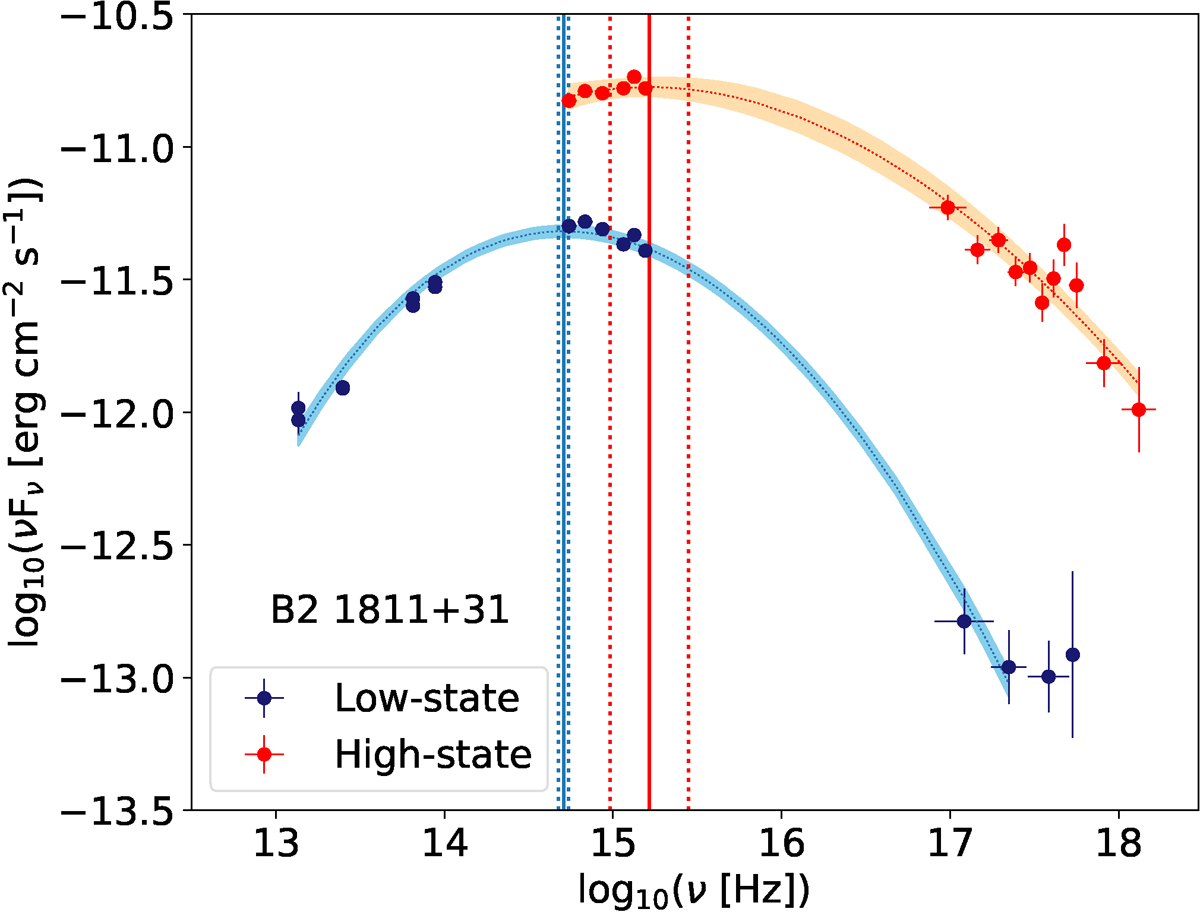
Fit of the infrared-to-X-ray SEDs characteristic of the B2 1811+31 low and high states with Eq. (7), in blue and red, respectively. The spectral points in the optical/UV range were reconstructed from Swift-UVOT observations, whereas the X-ray ones derive from Swift-XRT data. Infrared points are WISE data. The shaded areas correspond to the 1σ band fit uncertainties, while the best-fit synchrotron peak frequencies and their uncertainties are marked by the vertical solid and dotted lines.
Current usage metrics show cumulative count of Article Views (full-text article views including HTML views, PDF and ePub downloads, according to the available data) and Abstracts Views on Vision4Press platform.
Data correspond to usage on the plateform after 2015. The current usage metrics is available 48-96 hours after online publication and is updated daily on week days.
Initial download of the metrics may take a while.