Fig. 8.
Download original image
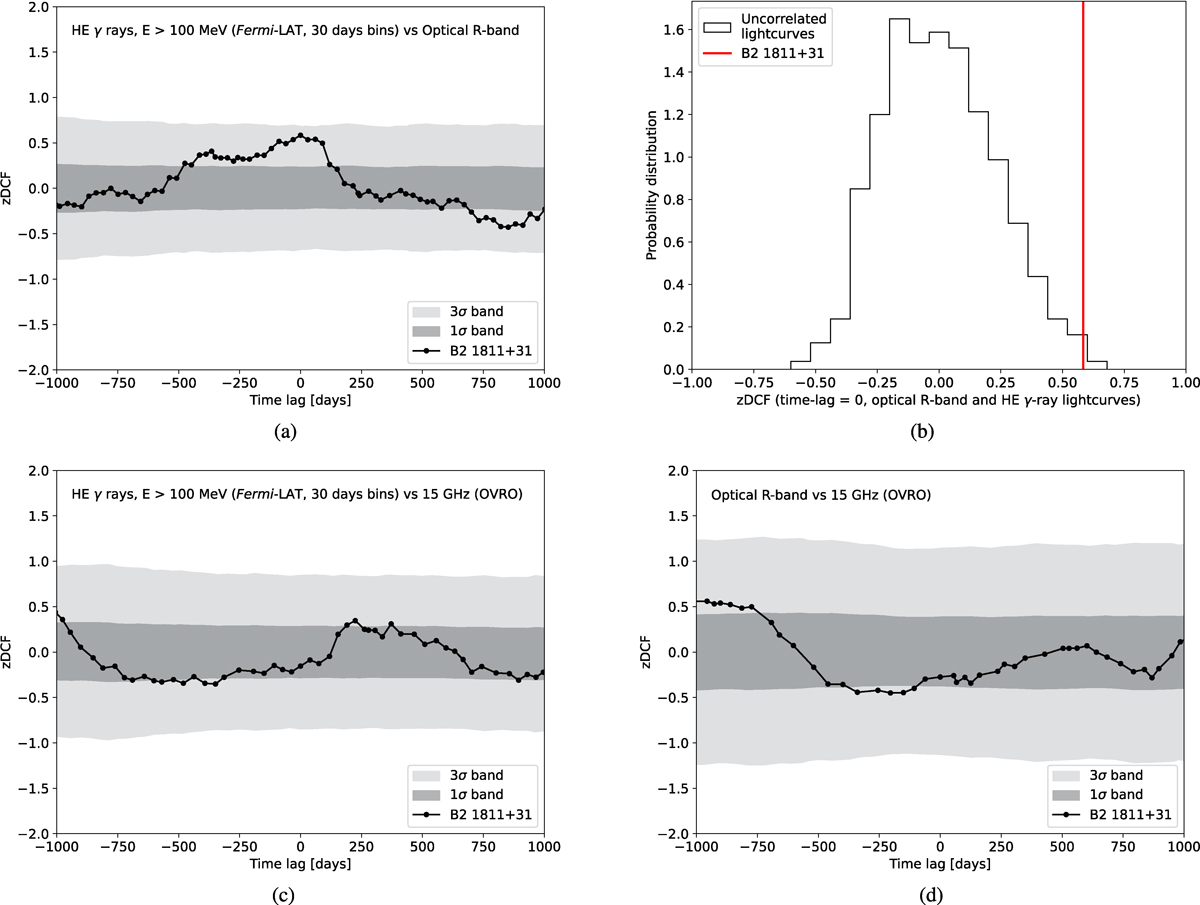
Summary of the zDCF analyses on the long-term B2 1811+31 lightcurves: (a) zDCF of the long-term HE γ-ray and R-band lightcurves, (c) zDCF of the long-term HE γ-ray and 15 GHz lightcurves, (d) zDCF of the long-term R-band and 15 GHz lightcurves. The 1σ and 3σ bands are indicated in dark and light gray, respectively. Panel (b) shows the distribution of the reconstructed zDCF at zero time-lag for 103 simulated uncorrelated HE γ-ray and optical lightcurves, whereas the red line marks the value reconstructed with the corresponding observed B2 1811+31 lightcurves in Figure 1.
Current usage metrics show cumulative count of Article Views (full-text article views including HTML views, PDF and ePub downloads, according to the available data) and Abstracts Views on Vision4Press platform.
Data correspond to usage on the plateform after 2015. The current usage metrics is available 48-96 hours after online publication and is updated daily on week days.
Initial download of the metrics may take a while.