Fig. 3.
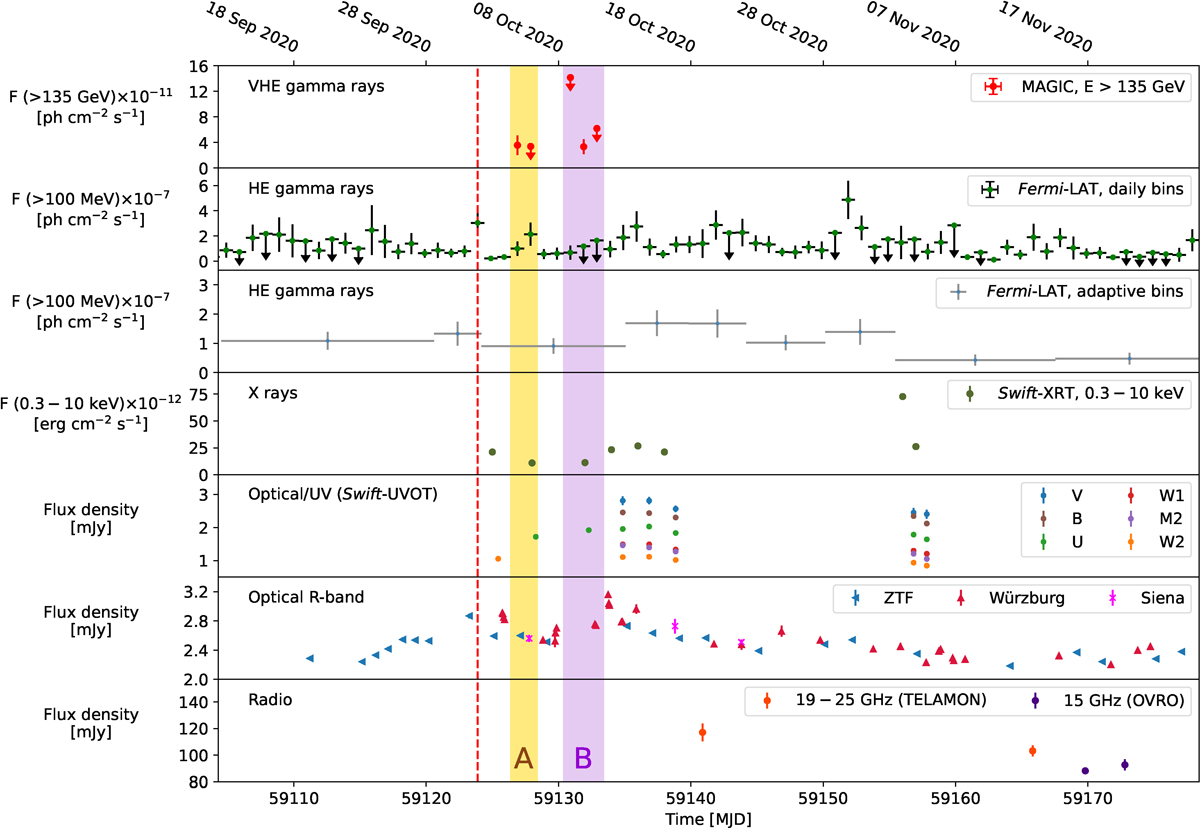
Download original image
MWL lightcurve of B2 1811+31 in a period of approximately 70 days surrounding the Fermi-LAT high-state detection on MJD 59123, marked by the dashed red line. From top to bottom panels: VHE γ-ray flux above 135 GeV from MAGIC, HE γ-ray flux above 100 MeV from Fermi-LAT in daily bins and using the ‘adaptive-binning’ method, X-ray flux in the 0.3−10 keV range from Swift-XRT, optical/UV data in the photometric filters of Swift-UVOT, optical R-band data and radio data. The shaded yellow and light violet bands indicate periods of 48 h and 72 h surrounding the two sets of MAGIC consecutive observation nights, respectively, defined as periods A and B in Section 6.
Current usage metrics show cumulative count of Article Views (full-text article views including HTML views, PDF and ePub downloads, according to the available data) and Abstracts Views on Vision4Press platform.
Data correspond to usage on the plateform after 2015. The current usage metrics is available 48-96 hours after online publication and is updated daily on week days.
Initial download of the metrics may take a while.