Fig. 2.
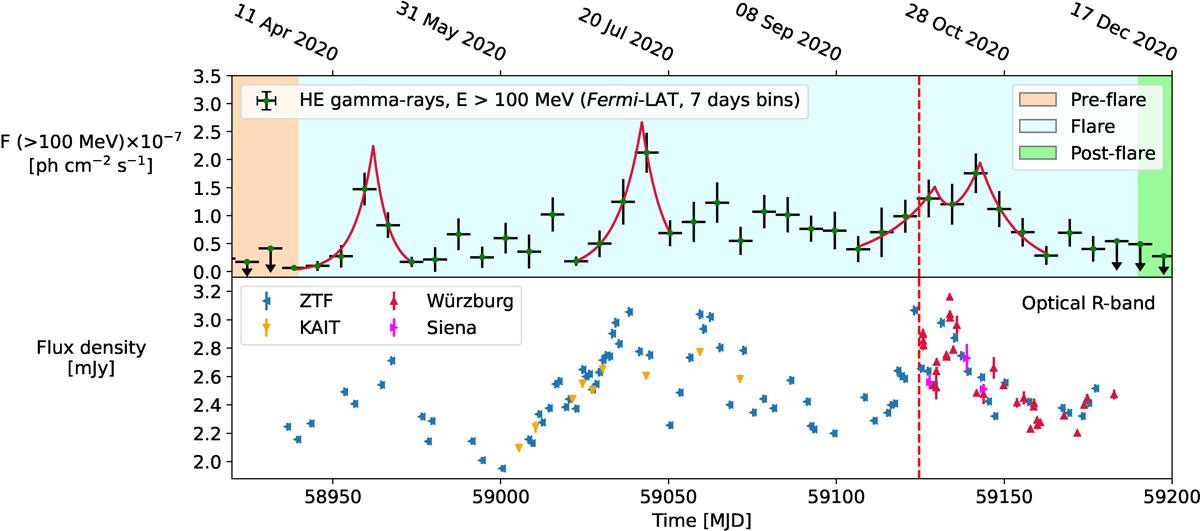
Download original image
MWL lightcurve of B2 1811+31 in HE γ-rays (weekly binned Fermi-LAT data, upper panel) and optical R-band (instruments are reported in the legend, lower panel) in a period of around 250 days surrounding the October 2020 high state. This period corresponds approximately to the ‘Flare’ period (Table 2). In the upper panel, the solid red lines show the double-exponential fit (Eq. (5)) of the rising and falling trends in the Fermi-LAT lightcurve (Section 3.1.2).
Current usage metrics show cumulative count of Article Views (full-text article views including HTML views, PDF and ePub downloads, according to the available data) and Abstracts Views on Vision4Press platform.
Data correspond to usage on the plateform after 2015. The current usage metrics is available 48-96 hours after online publication and is updated daily on week days.
Initial download of the metrics may take a while.