Fig. 12.
Download original image
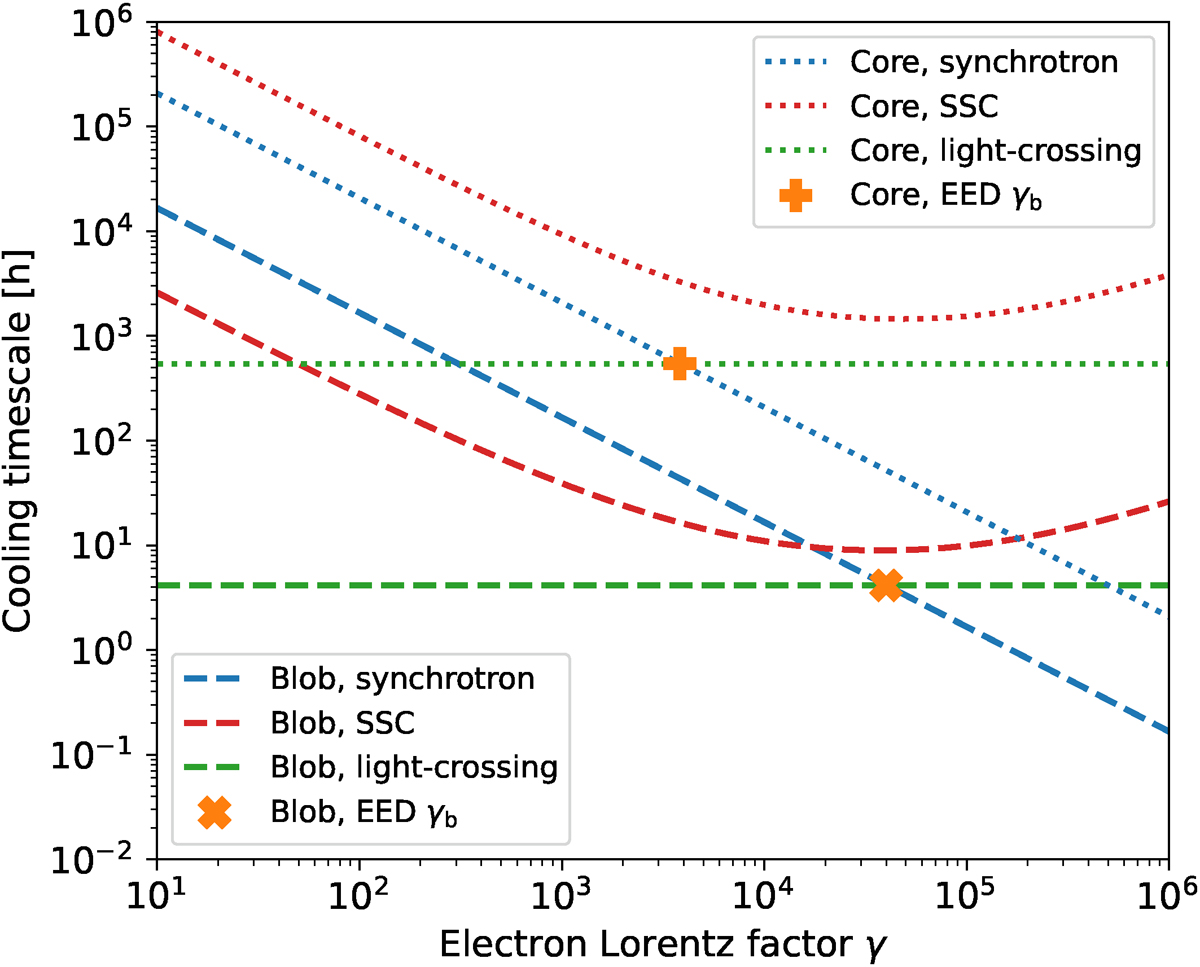
Competition among the cooling timescales for the two-zone model in Figure 11b, as a function of the electron Lorentz factor γ. The times are in the observer frame; that is, corrected by the corresponding ![]() with respect to the frames comoving with the two regions. Dashed (dotted) curves refer to the blob (core) region. Blue and red curves indicate the synchrotron and SSC cooling timescales, respectively, whereas the green lines represent the light-crossing times. The orange markers indicate the γb values of the EED within the two emission regions (Table 4).
with respect to the frames comoving with the two regions. Dashed (dotted) curves refer to the blob (core) region. Blue and red curves indicate the synchrotron and SSC cooling timescales, respectively, whereas the green lines represent the light-crossing times. The orange markers indicate the γb values of the EED within the two emission regions (Table 4).
Current usage metrics show cumulative count of Article Views (full-text article views including HTML views, PDF and ePub downloads, according to the available data) and Abstracts Views on Vision4Press platform.
Data correspond to usage on the plateform after 2015. The current usage metrics is available 48-96 hours after online publication and is updated daily on week days.
Initial download of the metrics may take a while.