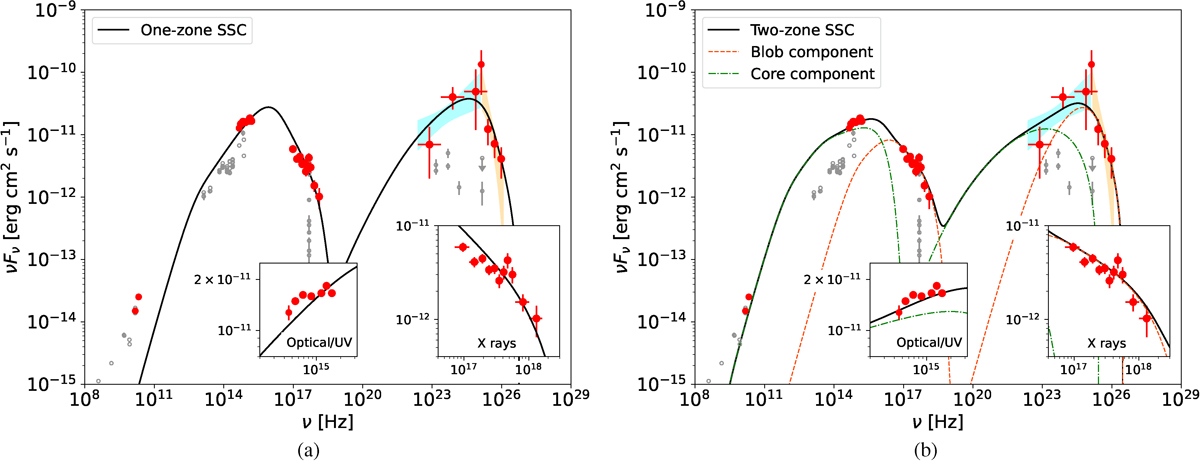
Fig. 11.

Download original image
Leptonic modeling of the broadband SED of B2 1811+31 during period B within the 2020 high state in VHE γ rays, marked by the red points. Archival data are indicated by the hollow gray points. The shaded blue and orange areas indicate the 1σ uncertainty bands on the intrinsic spectrum of the source derived from Fermi-LAT and MAGIC observations, respectively. The two insets show a zoom-in on the optical/UV and X-ray bands, respectively. For the two-zone SSC model, the contributions from the blob and core are indicated, respectively, by the orange and green lines, whereas the total is computed as the sum of the two. (a) One-zone SSC modeling. (b) Two-zone SSC modeling.
Current usage metrics show cumulative count of Article Views (full-text article views including HTML views, PDF and ePub downloads, according to the available data) and Abstracts Views on Vision4Press platform.
Data correspond to usage on the plateform after 2015. The current usage metrics is available 48-96 hours after online publication and is updated daily on week days.
Initial download of the metrics may take a while.


