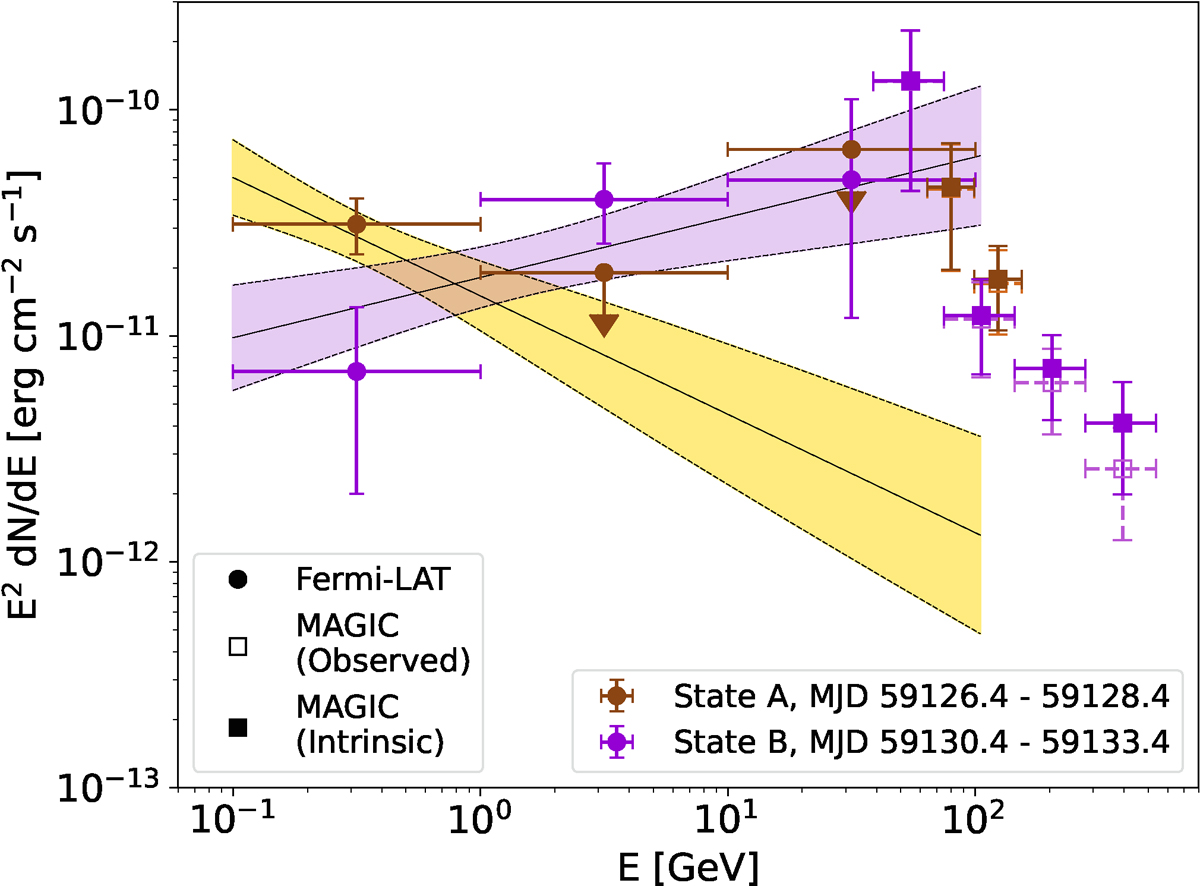
Fig. 10.
Download original image
Spectral energy distribution at HE and VHE γ rays of B2 1811+31 during periods A and B. For the two periods, spectral points are shown in brown and violet and the 1σ uncertainty bands are in shaded yellow and light violet, respectively. The points with full round markers are derived from Fermi-LAT data. For the two periods, the best-fit parameters of the spectrum reconstructed from Fermi-LAT observations are reported in Table C.5. The points with full square markers show the MAGIC EBL-corrected SEDs. The observed MAGIC spectral points are indicated with hollow square markers and dashed error bars.
Current usage metrics show cumulative count of Article Views (full-text article views including HTML views, PDF and ePub downloads, according to the available data) and Abstracts Views on Vision4Press platform.
Data correspond to usage on the plateform after 2015. The current usage metrics is available 48-96 hours after online publication and is updated daily on week days.
Initial download of the metrics may take a while.