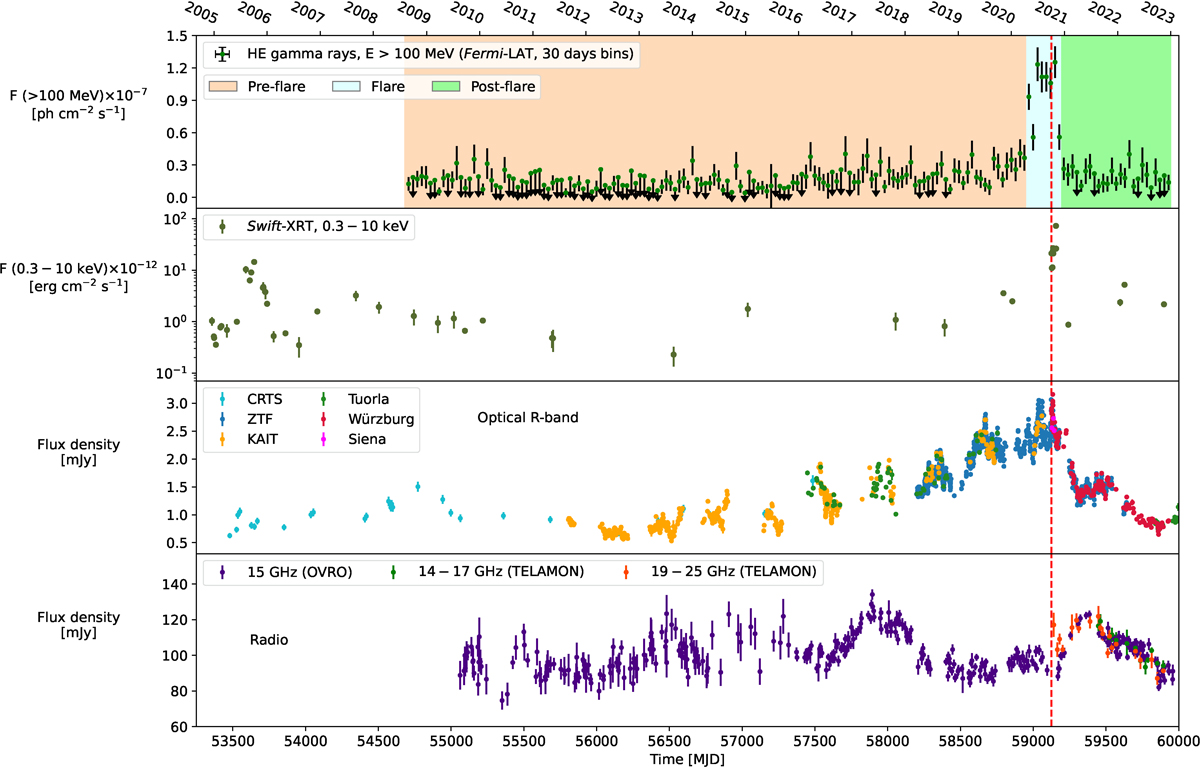
Fig. 1.
Download original image
B2 1811+31 long-term lightcurve collected from 2005 to 2023. From top to bottom panels: HE γ-ray flux above 100 MeV from Fermi-LAT monthly binned data, X-ray flux in the 0.3−10 keV energy range from Swift-XRT, optical R-band data and radio data. The dashed red line marks the Fermi-LAT high-state detection on October 1, 2020 (MJD 59123). The shaded light orange, light blue, and green bands in the top panel indicate the “Pre-flare”, “Flare” and “Post-flare” periods, respectively (Table 2).
Current usage metrics show cumulative count of Article Views (full-text article views including HTML views, PDF and ePub downloads, according to the available data) and Abstracts Views on Vision4Press platform.
Data correspond to usage on the plateform after 2015. The current usage metrics is available 48-96 hours after online publication and is updated daily on week days.
Initial download of the metrics may take a while.