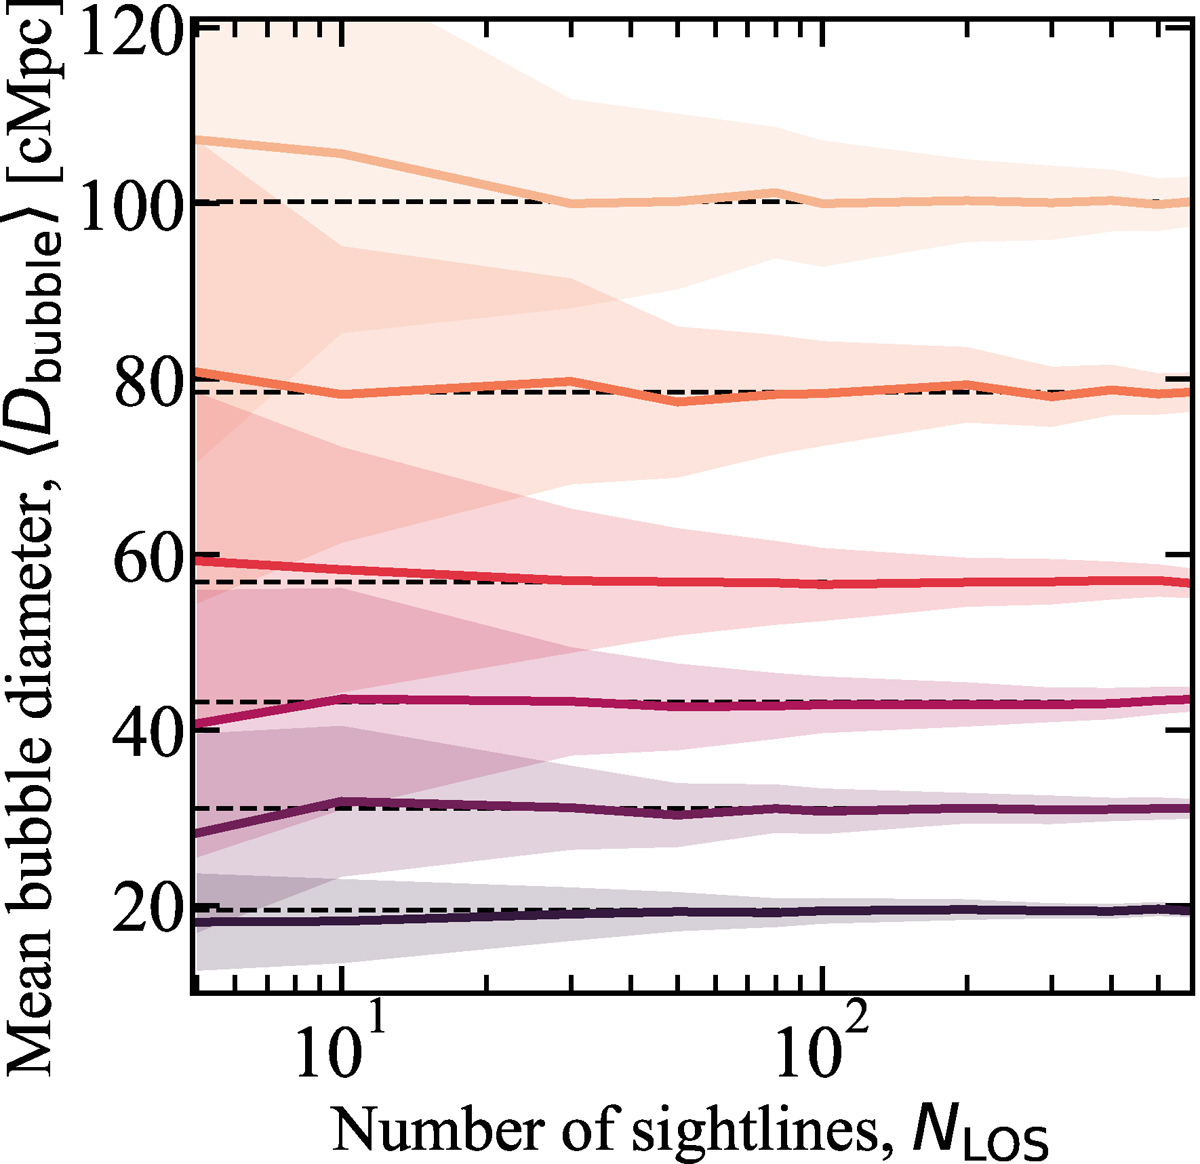
Fig. 11.
Download original image
Mean bubble diameter recovered from measuring bubbles along NLOS sightlines using our bubble mapping algorithm (Section 4), for simulations with different bubble-size distributions. The solid and shaded regions show the median and 68% range of the recovered mean bubble size from 150 realizations. With ≳15−30 sightlines it would be possible to distinguish different bubble size distributions.
Current usage metrics show cumulative count of Article Views (full-text article views including HTML views, PDF and ePub downloads, according to the available data) and Abstracts Views on Vision4Press platform.
Data correspond to usage on the plateform after 2015. The current usage metrics is available 48-96 hours after online publication and is updated daily on week days.
Initial download of the metrics may take a while.