Fig. 7.
Download original image
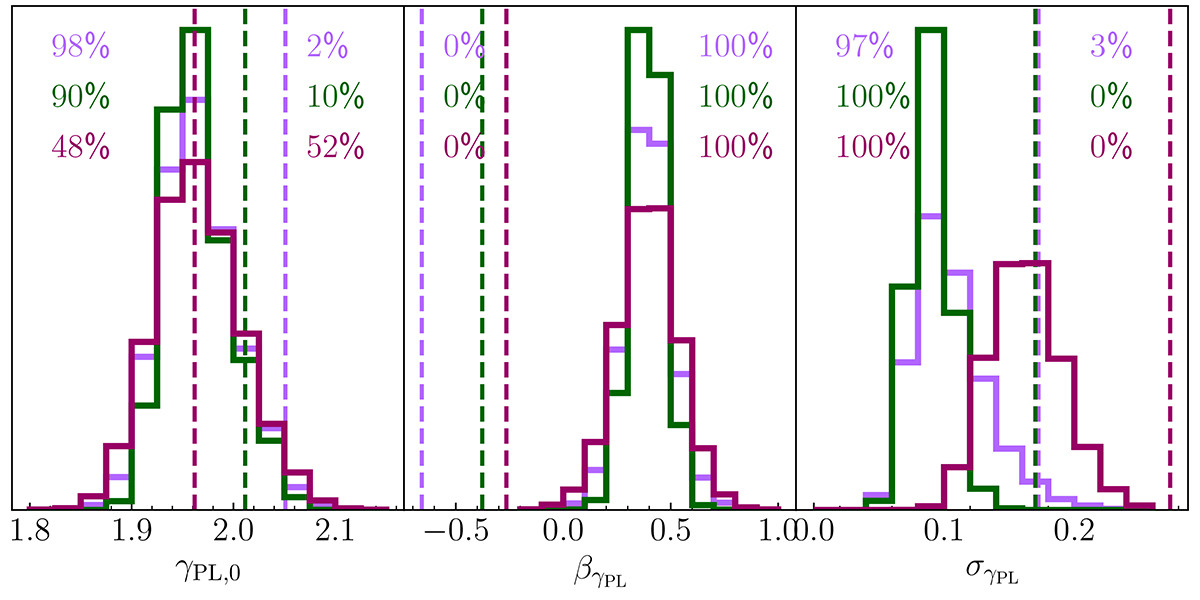
Posterior predicted distribution of the coefficients describing the γPL − Σ*(sps) relation of SLACS lenses. The coefficients are defined in Equation (32). For each coefficient, three distributions are shown, each to be compared with the value obtained by fitting the measurements of Shajib et al. (2021), Etherington et al. (2022) and Tan et al. (2024). The colour of each distribution corresponds to that of the data points in Figure 6. The distributions are different because the observed samples and the observational uncertainties vary from one work to the other. In each panel, the percentages to the left and right of the vertical lines indicate the fraction of posterior predicted samples for which the mock test quantity is smaller or larger than observed.
Current usage metrics show cumulative count of Article Views (full-text article views including HTML views, PDF and ePub downloads, according to the available data) and Abstracts Views on Vision4Press platform.
Data correspond to usage on the plateform after 2015. The current usage metrics is available 48-96 hours after online publication and is updated daily on week days.
Initial download of the metrics may take a while.