Fig. 6.
Download original image
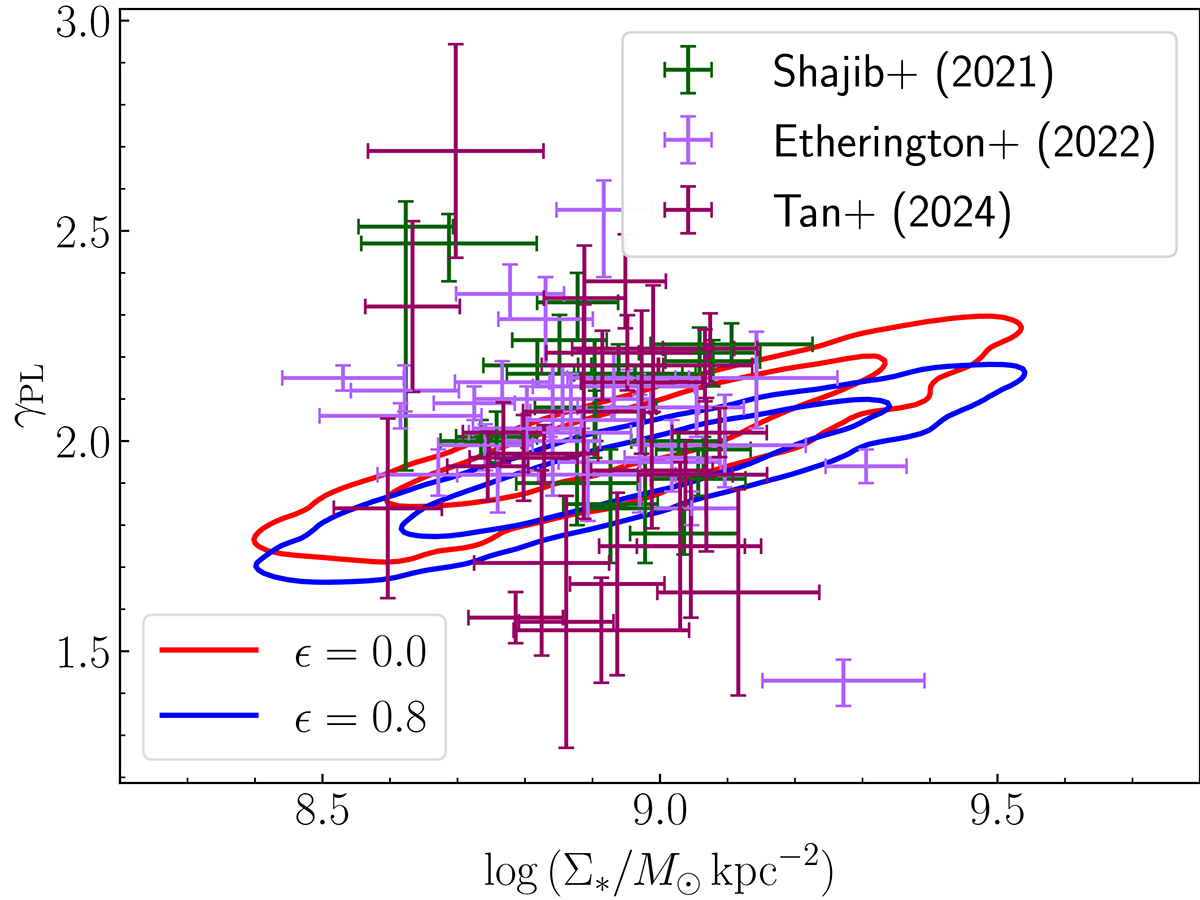
Posterior predicted distribution in the lensing-only power-law slope, as a function of stellar mass density. Simulated values of γPL have been obtained from Equation (31). The two sets of contours correspond to the posteriors obtained by fitting models with a fixed value of ϵ, as indicated in the legend. Error bars are measurements from Shajib et al. (2021), Etherington et al. (2022), Tan et al. (2024).
Current usage metrics show cumulative count of Article Views (full-text article views including HTML views, PDF and ePub downloads, according to the available data) and Abstracts Views on Vision4Press platform.
Data correspond to usage on the plateform after 2015. The current usage metrics is available 48-96 hours after online publication and is updated daily on week days.
Initial download of the metrics may take a while.