Open Access
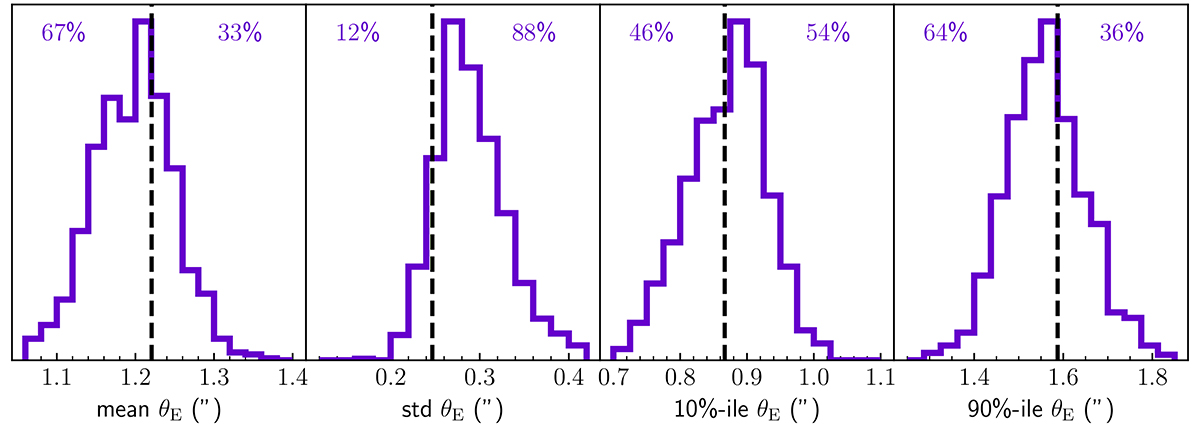
Fig. 5.
Download original image
Posterior predictive test of the goodness-of-fit. Vertical lines indicate the observed values of the four test quantities. In each panel, the percentage to the left and right of the vertical line indicate the fraction of posterior predicted samples for which the mock test quantity is smaller or larger than observed.
Current usage metrics show cumulative count of Article Views (full-text article views including HTML views, PDF and ePub downloads, according to the available data) and Abstracts Views on Vision4Press platform.
Data correspond to usage on the plateform after 2015. The current usage metrics is available 48-96 hours after online publication and is updated daily on week days.
Initial download of the metrics may take a while.