Fig. 3.
Download original image
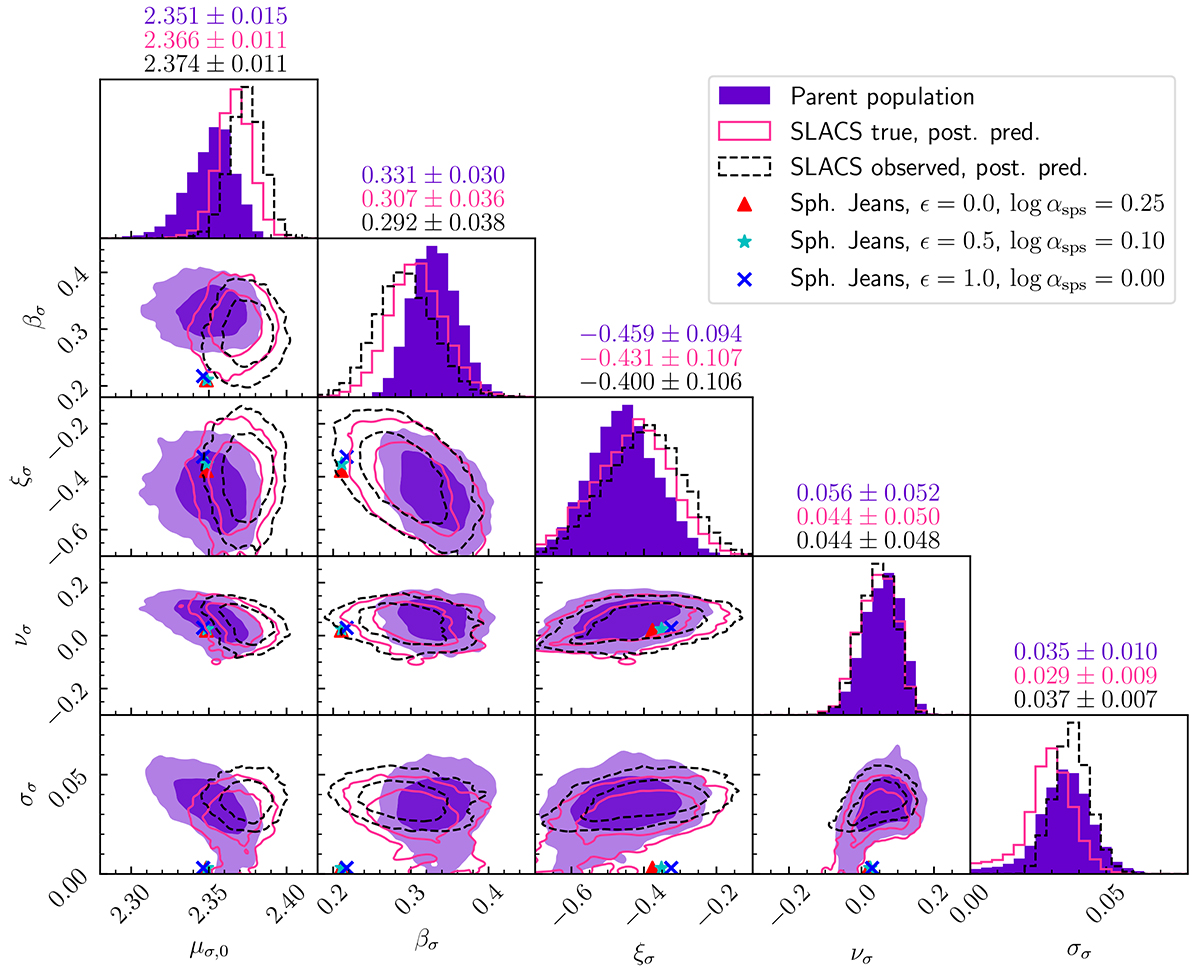
Posterior probability of the parameters describing the distribution in velocity dispersion. These are defined in Equation (19) and Equation (20). Filled purple contours: Posterior probability of the model. Solid pink contours: Posterior predicted fundamental hyperplane of the SLACS lenses. Dashed black contours: Posterior predicted fundamental hyperplane of the SLACS lenses, based on the observed (noisy) velocity dispersion. The mean and standard deviation of the marginal posterior distribution in each parameter is indicated above the corresponding histogram. Contour levels indicate regions of 68% and 95% enclosed probabilities. The three points are values of the parameters obtained by means of dynamical modelling via the isotropic spherical Jeans equation, for different pairs of values of (αsps, ϵ).
Current usage metrics show cumulative count of Article Views (full-text article views including HTML views, PDF and ePub downloads, according to the available data) and Abstracts Views on Vision4Press platform.
Data correspond to usage on the plateform after 2015. The current usage metrics is available 48-96 hours after online publication and is updated daily on week days.
Initial download of the metrics may take a while.