Fig. 1.
Download original image
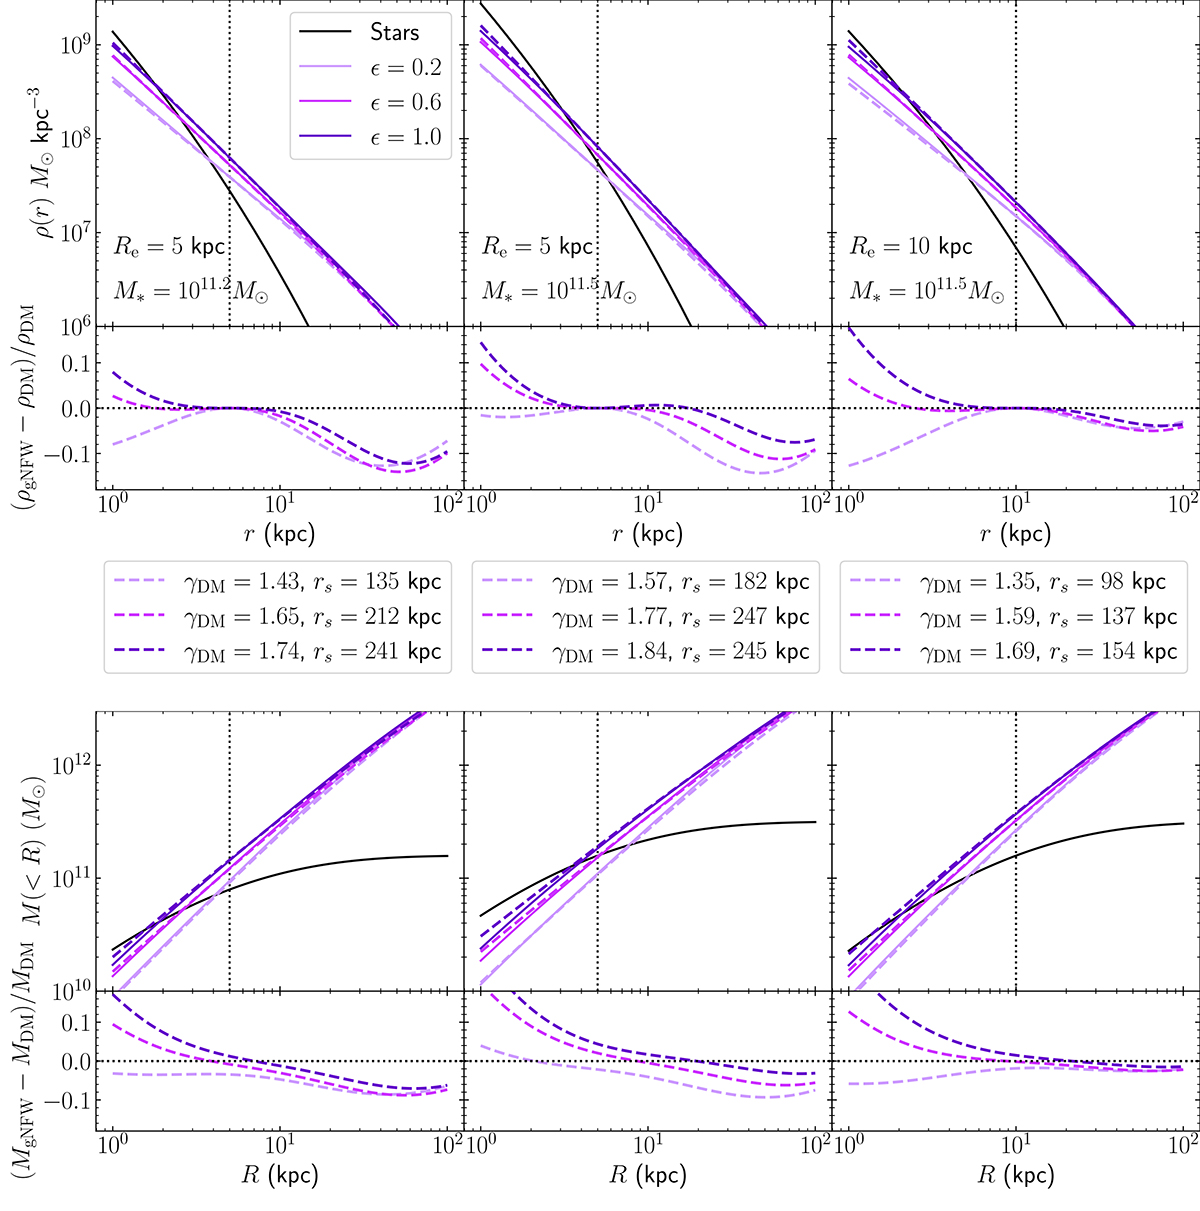
Stellar and dark matter distribution of example model galaxies. Top: Density profile. Bottom: Enclosed projected mass. In each top subpanel, the solid black line shows the stellar mass distribution, which follows a spherically de-projected de Vaucouleurs profile, with half-light radius indicated by the vertical dotted line. Solid coloured lines are dark matter profiles obtained by applying the adiabatic contraction prescription of Equation (8), with different values of the contraction efficiency parameter ϵ. Dashed lines are gNFW profile approximation of the contracted profile. The bottom subpanels show the relative difference between the gNFW and the corresponding adiabatically contracted profile. The legends at the bottom indicate the values of γDM and rs of each gNFW model. All galaxies have a halo mass of M200 = 1013 M⊙. Stellar mass and half-light radius vary as indicated on the top panels.
Current usage metrics show cumulative count of Article Views (full-text article views including HTML views, PDF and ePub downloads, according to the available data) and Abstracts Views on Vision4Press platform.
Data correspond to usage on the plateform after 2015. The current usage metrics is available 48-96 hours after online publication and is updated daily on week days.
Initial download of the metrics may take a while.