Fig. 4
Download original image
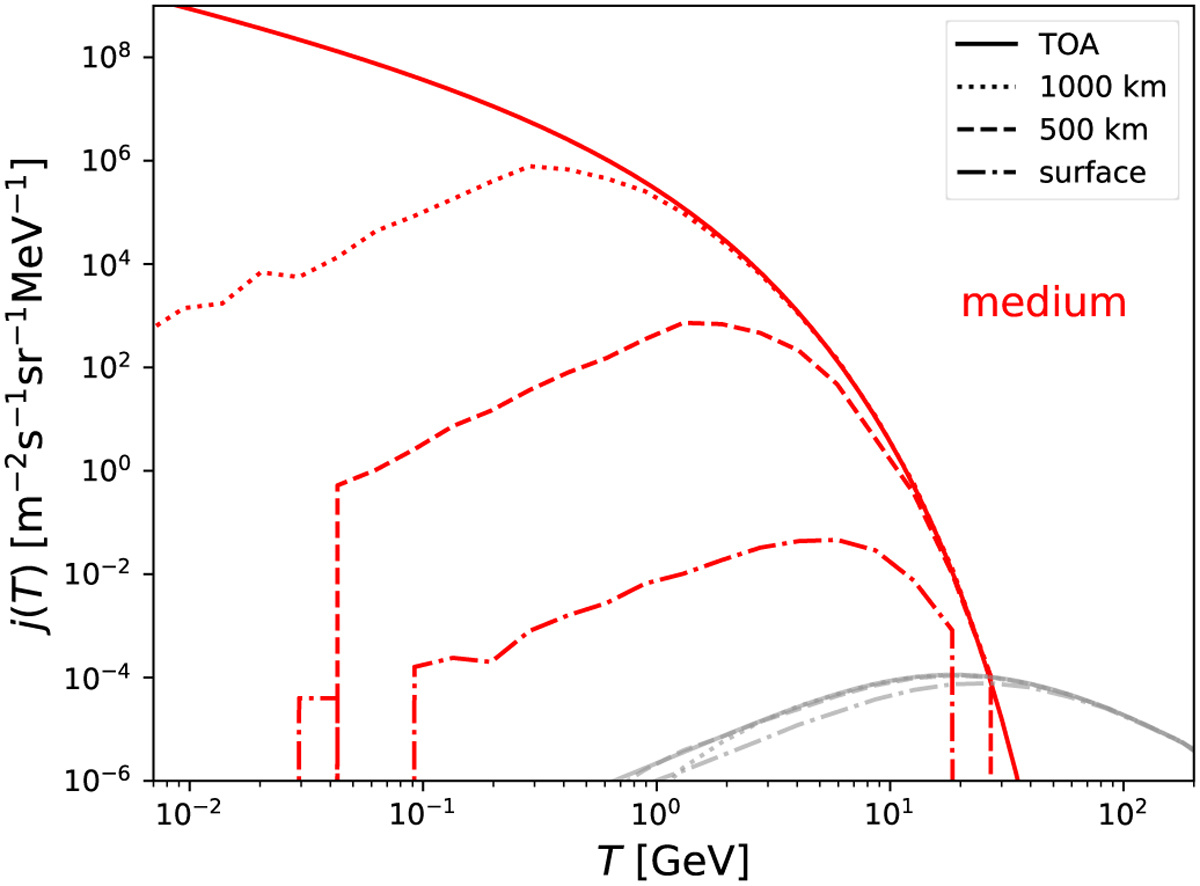
Differential intensity, j(T, z), of solar cosmic rays (red lines) and Galactic cosmic rays (grey lines) in the early Earth atmosphere for Ω = 6Ω⊙, plotted at different heights above and at the surface as a function of T. The linestyles represent these heights (solid: top of atmosphere (TOA); dotted: 1000 km; dashed: 500 km; dot-dashed: surface). Here the surface is defined as z = 0.001 km.
Current usage metrics show cumulative count of Article Views (full-text article views including HTML views, PDF and ePub downloads, according to the available data) and Abstracts Views on Vision4Press platform.
Data correspond to usage on the plateform after 2015. The current usage metrics is available 48-96 hours after online publication and is updated daily on week days.
Initial download of the metrics may take a while.