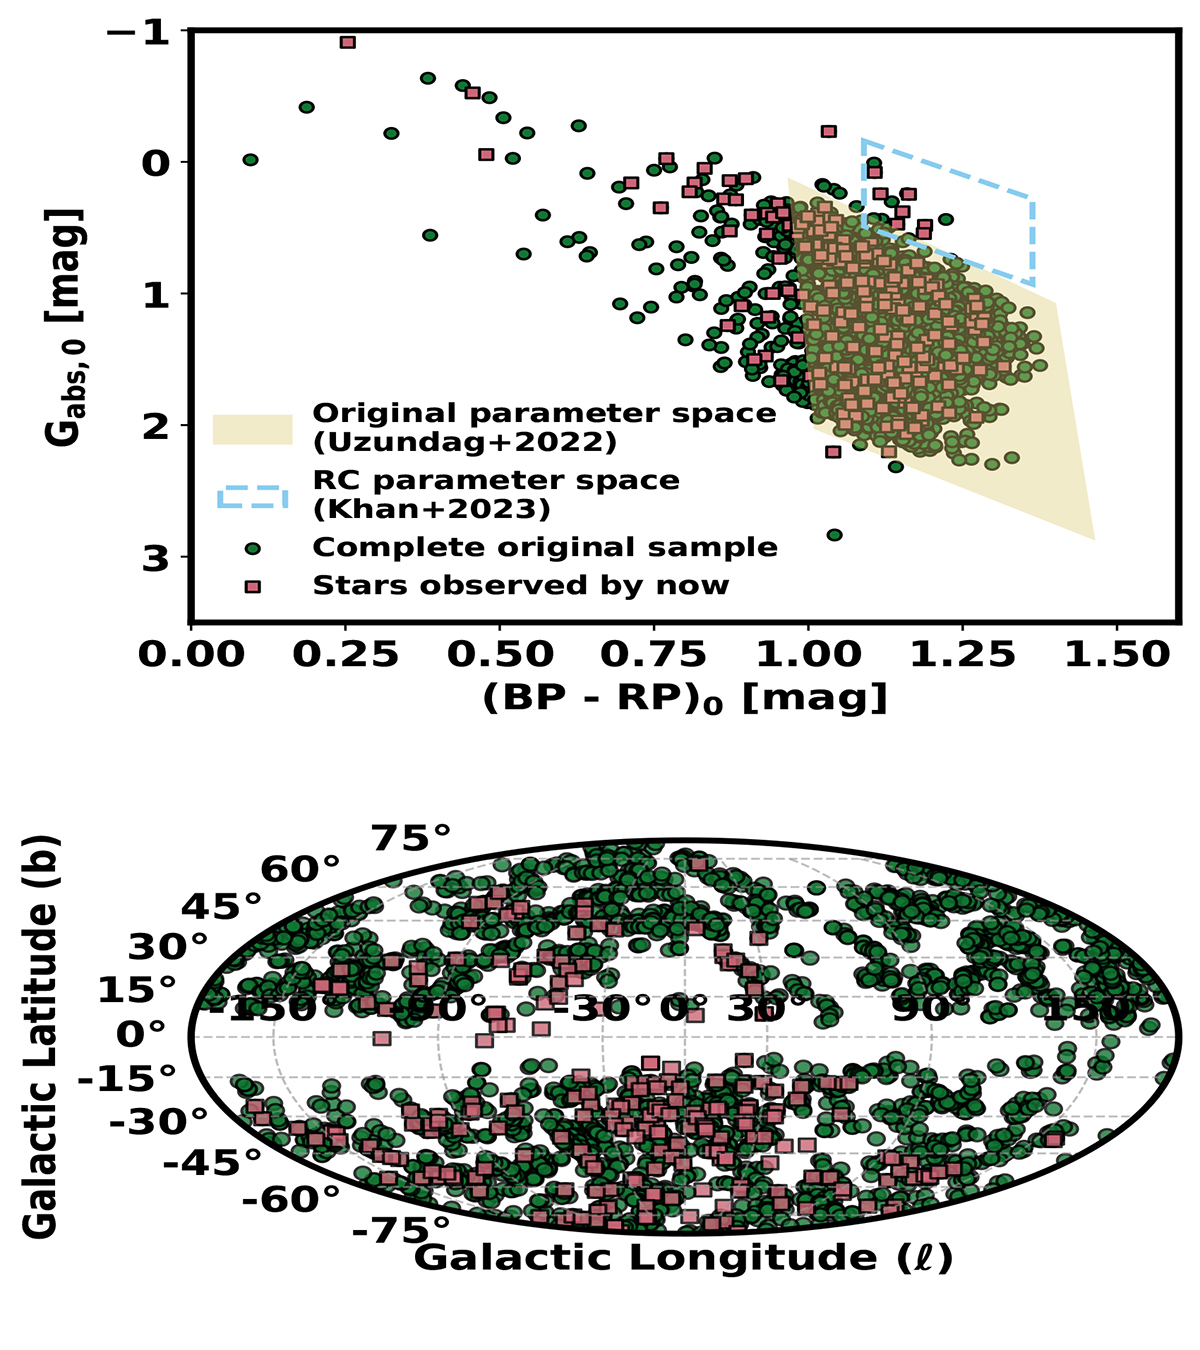
Fig. A.2.
Download original image
Upper panel: Updated Gaia colour-magnitude distribution for the 2777 stars selected in Paper I using DR3 parallaxes and extinction coefficients. Green dots represent the original complete sample, while pink squares represent the stars observed by now. The yellow shaded box is defined in Paper I (eq. (1)-(4)), and the sky-blue dashed rectangle is the RC parameter space from Khan et al. (2023). Lower panel: Sky distribution (Mollweide projection) in Galactic coordinates. The colours are the same as in the upper plot.
Current usage metrics show cumulative count of Article Views (full-text article views including HTML views, PDF and ePub downloads, according to the available data) and Abstracts Views on Vision4Press platform.
Data correspond to usage on the plateform after 2015. The current usage metrics is available 48-96 hours after online publication and is updated daily on week days.
Initial download of the metrics may take a while.