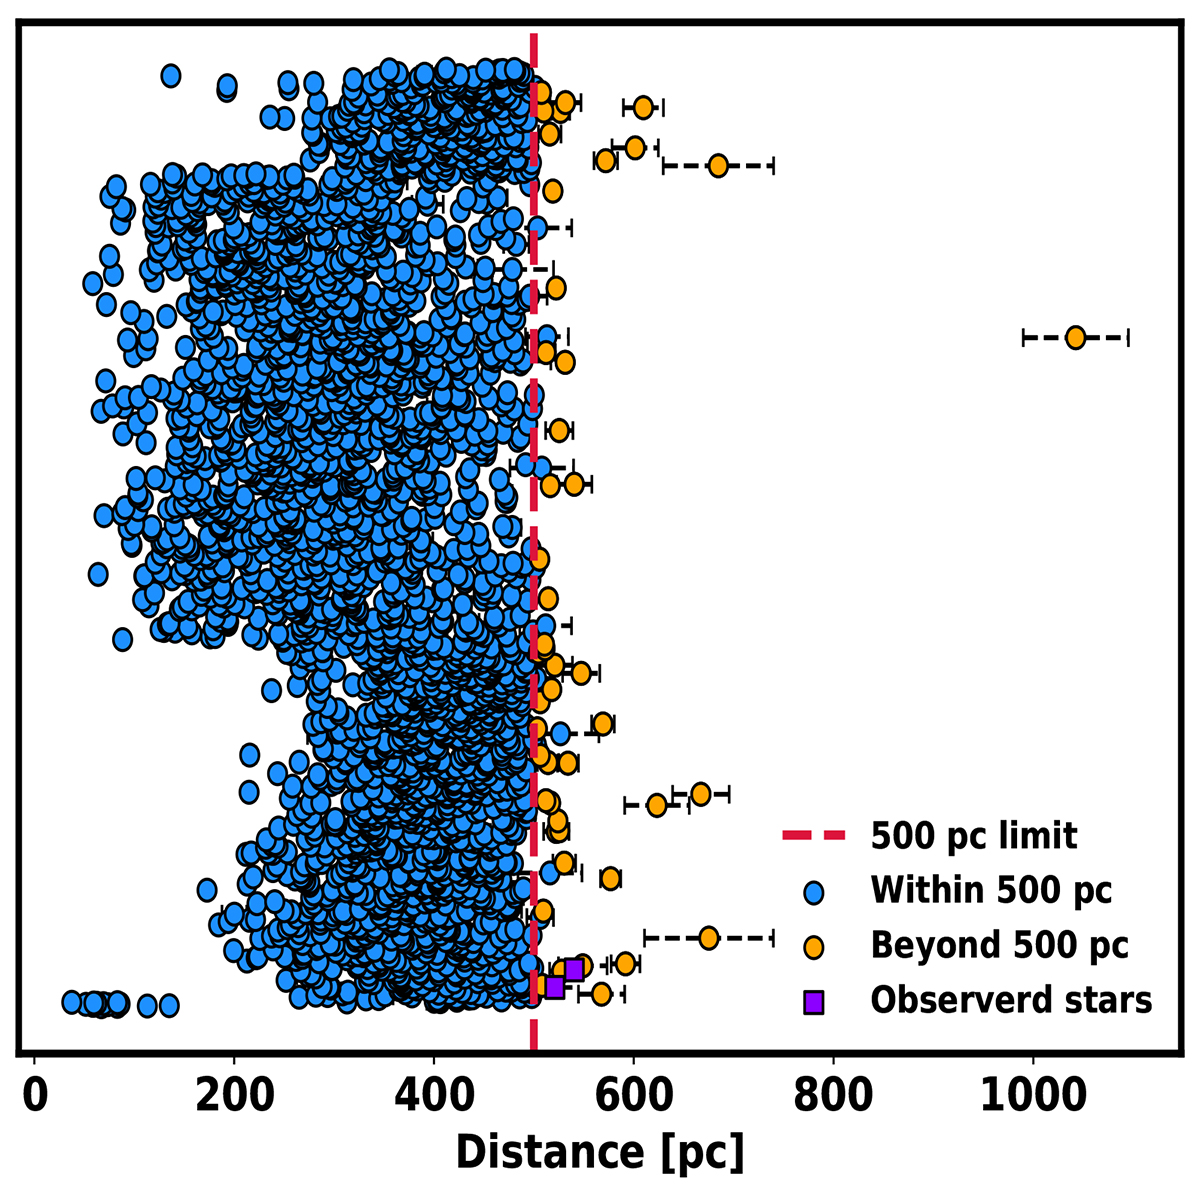
Fig. A.1.
Download original image
Updated distances using DR3 parallaxes. The red dashed vertical line represents the 500 pc limit. Blue dots indicate targets with distances consistent with 500 pc within their errors. Orange dots indicate those beyond 500 pc, and purple squares mark observed targets beyond the limit. Error bars are not visible for some dots as they are smaller than the dot size.
Current usage metrics show cumulative count of Article Views (full-text article views including HTML views, PDF and ePub downloads, according to the available data) and Abstracts Views on Vision4Press platform.
Data correspond to usage on the plateform after 2015. The current usage metrics is available 48-96 hours after online publication and is updated daily on week days.
Initial download of the metrics may take a while.