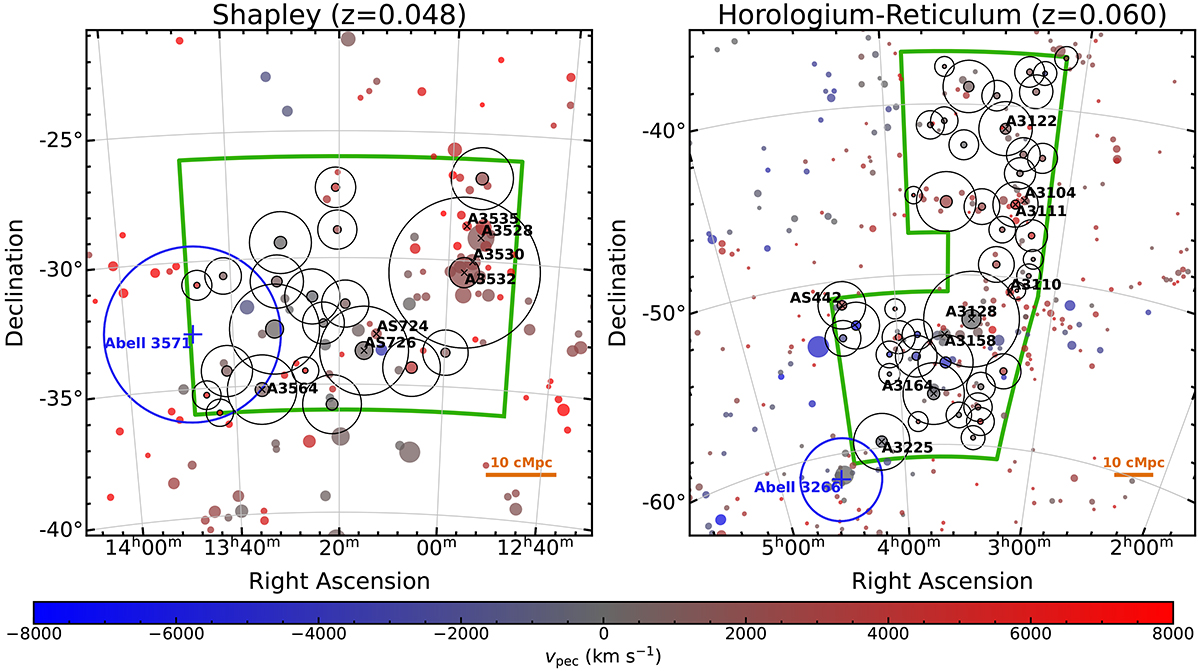
Fig. 9.

Download original image
Optical groups and clusters identified with redMaPPer within and around the Shapley (left) and Horologium-Reticulum (right) superclusters. The colours represent the velocity with respect to the mean supercluster redshift (titles). The sizes are equal to r200 determined through the redMaPPer richness. The coloured circles with black outlines are primary clusters (only shown within the supercluster regions), and circles without the black outline are secondary clusters or clusters outside the CHANCES supercluster survey areas, which are marked with green polygons. For primary clusters, we also show 5r200 with a black circle. The blue crosses and circles mark clusters Abell 3571 (left) and Abell 3266 (right), which are at the supercluster redshifts, but are targeted individually as CHANCES main clusters. We also mark the most massive redMaPPer systems associated with Abell clusters with black crosses (not all of them are primaries).
Current usage metrics show cumulative count of Article Views (full-text article views including HTML views, PDF and ePub downloads, according to the available data) and Abstracts Views on Vision4Press platform.
Data correspond to usage on the plateform after 2015. The current usage metrics is available 48-96 hours after online publication and is updated daily on week days.
Initial download of the metrics may take a while.


