Fig. 8.
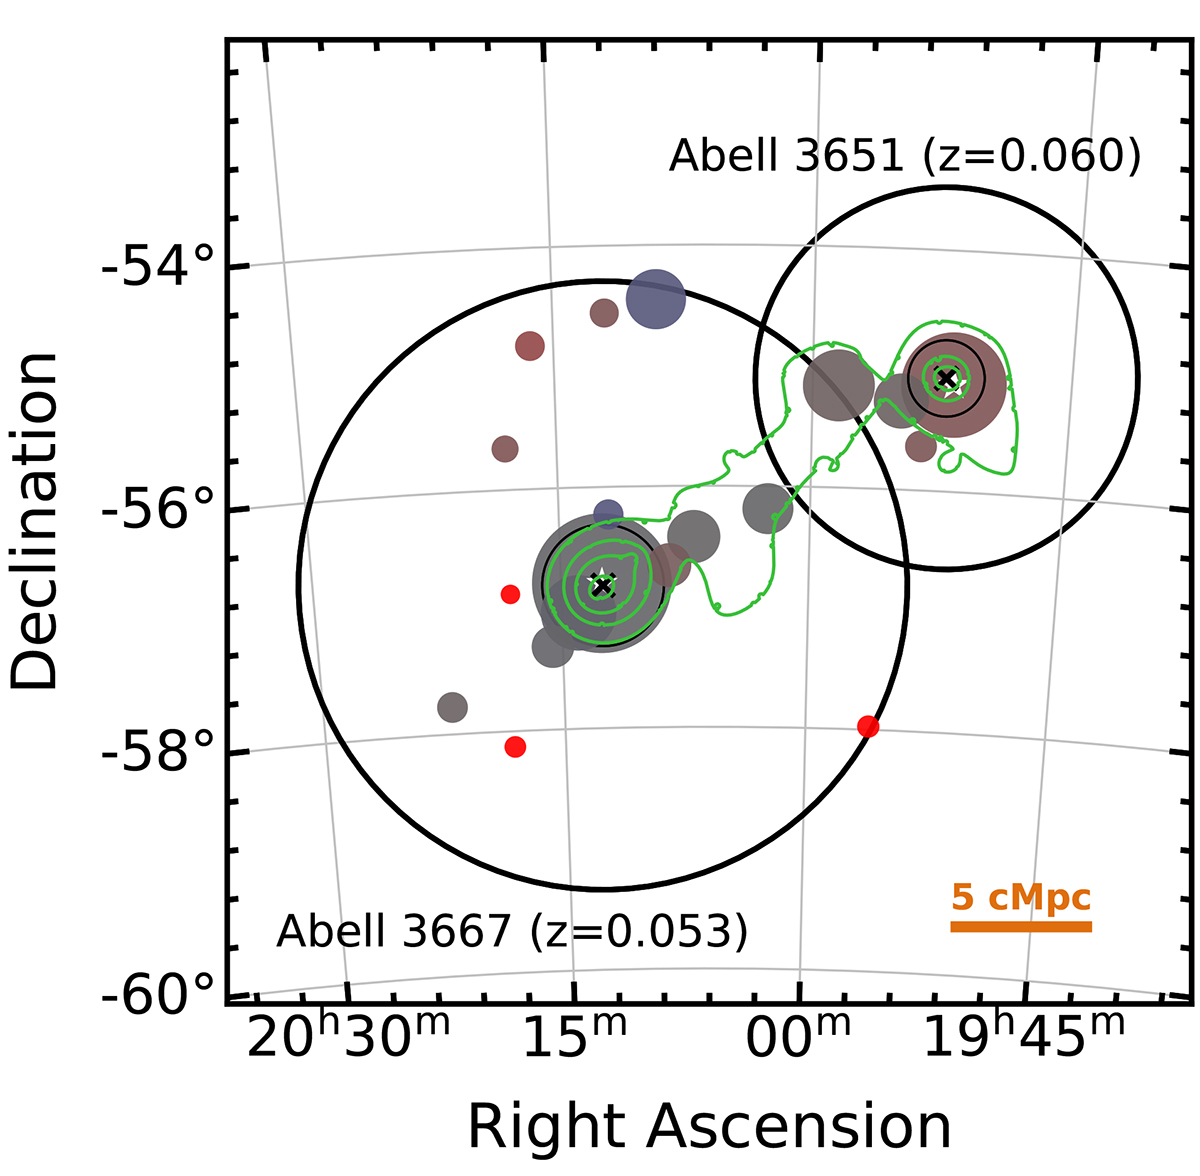
Download original image
The Abell 3651/3667 system as an example of overlapping CHANCES clusters (see Sect. 4.2). The symbols and colours are the same as in Fig. 5, but we do not highlight redMaPPer systems according to the CHANCES velocity dispersions. The circle colours are with respect to a reference z = 0.056, and the orange bar at the bottom right shows 5 comoving Mpc at the same redshift. The green contours show the eROSITA detection of hot gas within and between the clusters (Dietl et al. 2024).
Current usage metrics show cumulative count of Article Views (full-text article views including HTML views, PDF and ePub downloads, according to the available data) and Abstracts Views on Vision4Press platform.
Data correspond to usage on the plateform after 2015. The current usage metrics is available 48-96 hours after online publication and is updated daily on week days.
Initial download of the metrics may take a while.