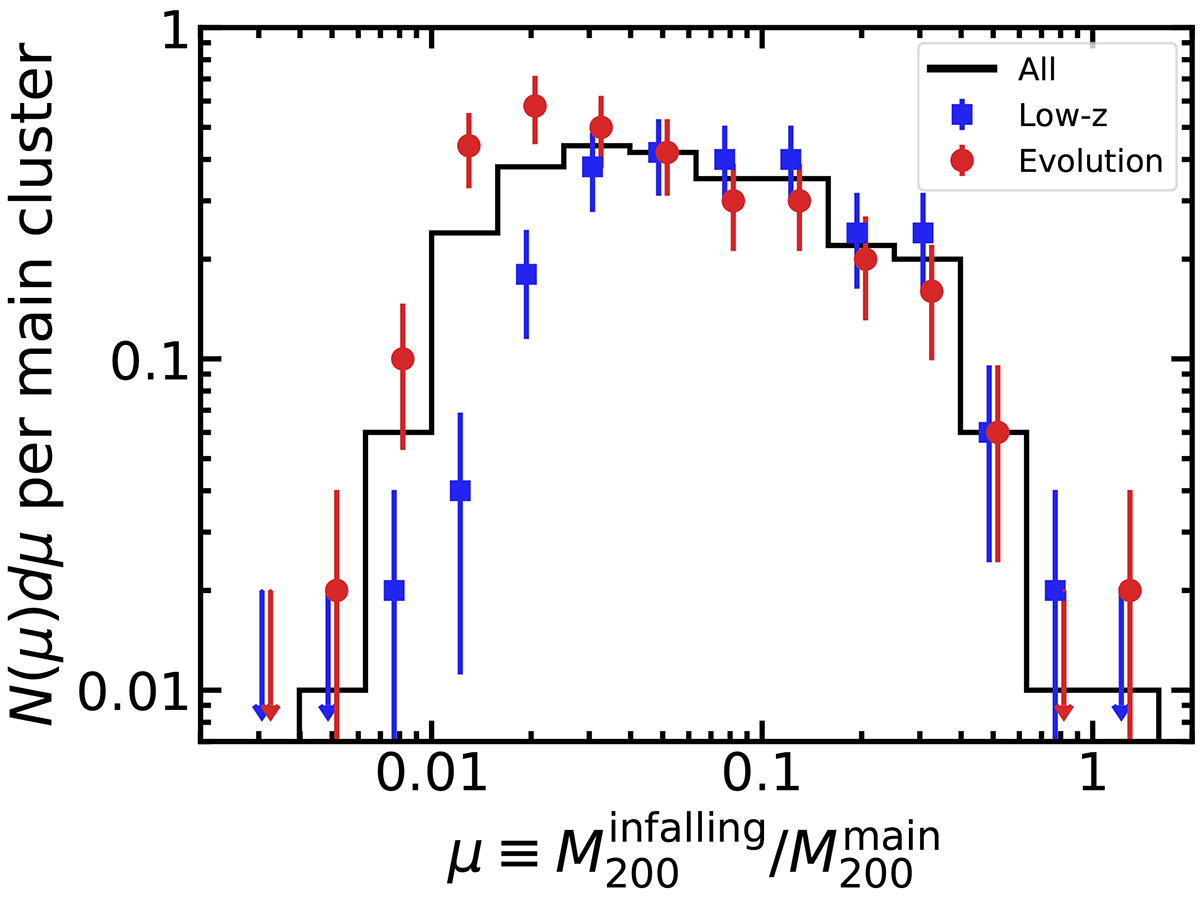
Fig. 7.
Download original image
Mass functions of infalling groups for the Low-z (blue) and Evolution (red) samples and for the two combined (black), including only redMaPPer groups with spectroscopic redshifts and |vpec|< 3σmain. Differential counts are normalised to the number of CHANCES clusters in each sample and are not corrected for incompleteness. The error bars are Poisson uncertainties, and the arrows are 1σ upper limits. We show the full sample as a histogram and omit the error bars to avoid cluttering. The blue and red data points are slightly shifted horizontally for clarity.
Current usage metrics show cumulative count of Article Views (full-text article views including HTML views, PDF and ePub downloads, according to the available data) and Abstracts Views on Vision4Press platform.
Data correspond to usage on the plateform after 2015. The current usage metrics is available 48-96 hours after online publication and is updated daily on week days.
Initial download of the metrics may take a while.