Fig. 6.
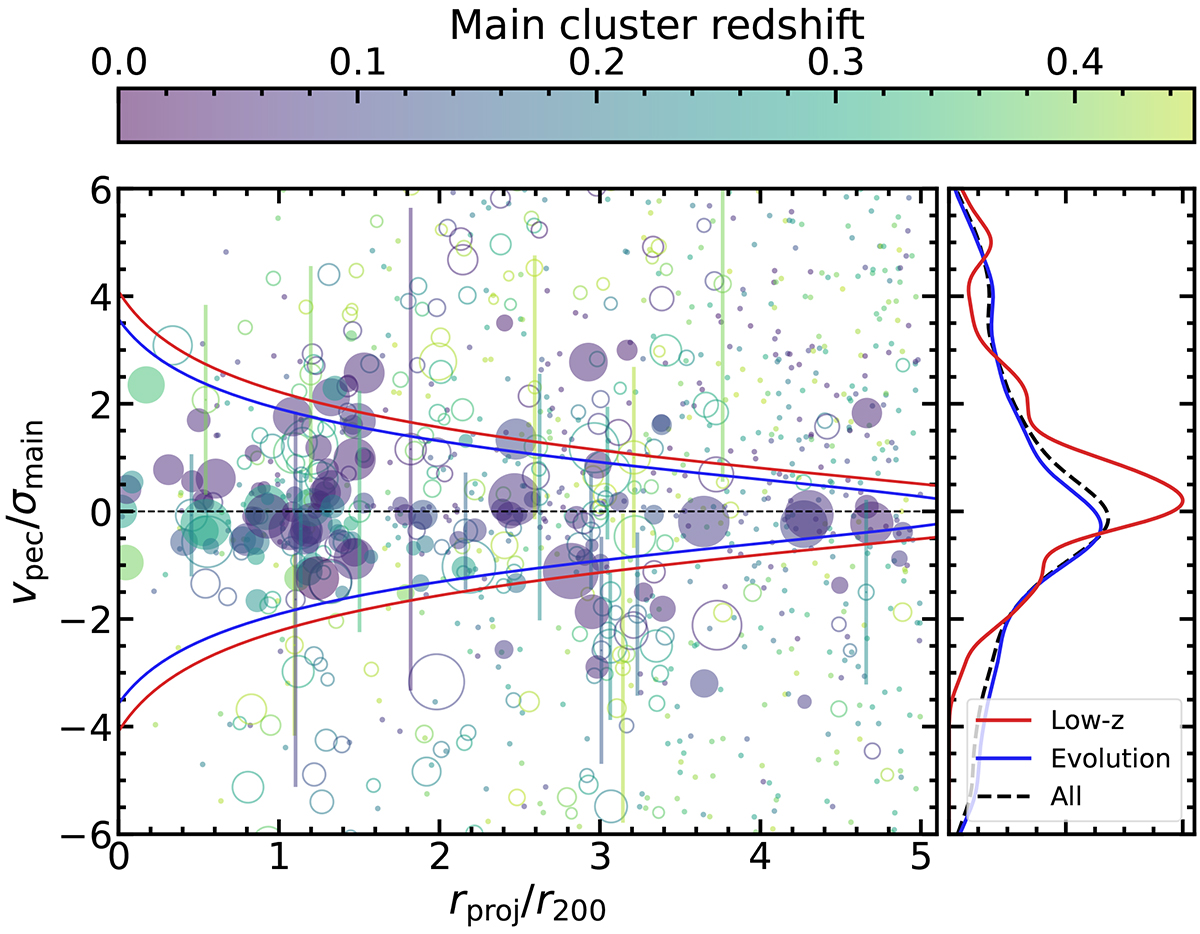
Download original image
Line-of-sight velocity vs. projected distance of redMaPPer groups around all CHANCES clusters, normalised by the velocity dispersion and r200 of each CHANCES cluster, respectively. Each circle shows a redMaPPer group with a spectroscopic redshift, has a radius proportional to the group richness-derived r200 in units of each CHANCES cluster r200, and is colour-coded by redshift. The filled and open circles show clusters with uncertainties δvpec smaller and larger than σmain, respectively. We show uncertainties for a random 10% of the latter for illustration; the uncertainties for filled circles are about the circle size and are not shown. The small points show groups with photometric redshifts. redMaPPer groups corresponding to the main CHANCES cluster are excluded from this plot. The red and blue lines in the main panel show the escape velocities for typical Low-z and Evolution clusters; groups with higher peculiar velocities are expected to be unbound from the respective CHANCES cluster. The right panel shows kernel density estimates of the peculiar-velocity distributions of redMaPPer groups with spectroscopic redshifts only (filled and empty circles in the main panel), using a Gaussian kernel with a width of 0.2 for the Low-z (red) and Evolution (blue) samples, and the combined distribution (dashed black).
Current usage metrics show cumulative count of Article Views (full-text article views including HTML views, PDF and ePub downloads, according to the available data) and Abstracts Views on Vision4Press platform.
Data correspond to usage on the plateform after 2015. The current usage metrics is available 48-96 hours after online publication and is updated daily on week days.
Initial download of the metrics may take a while.