Fig. 5.

Download original image
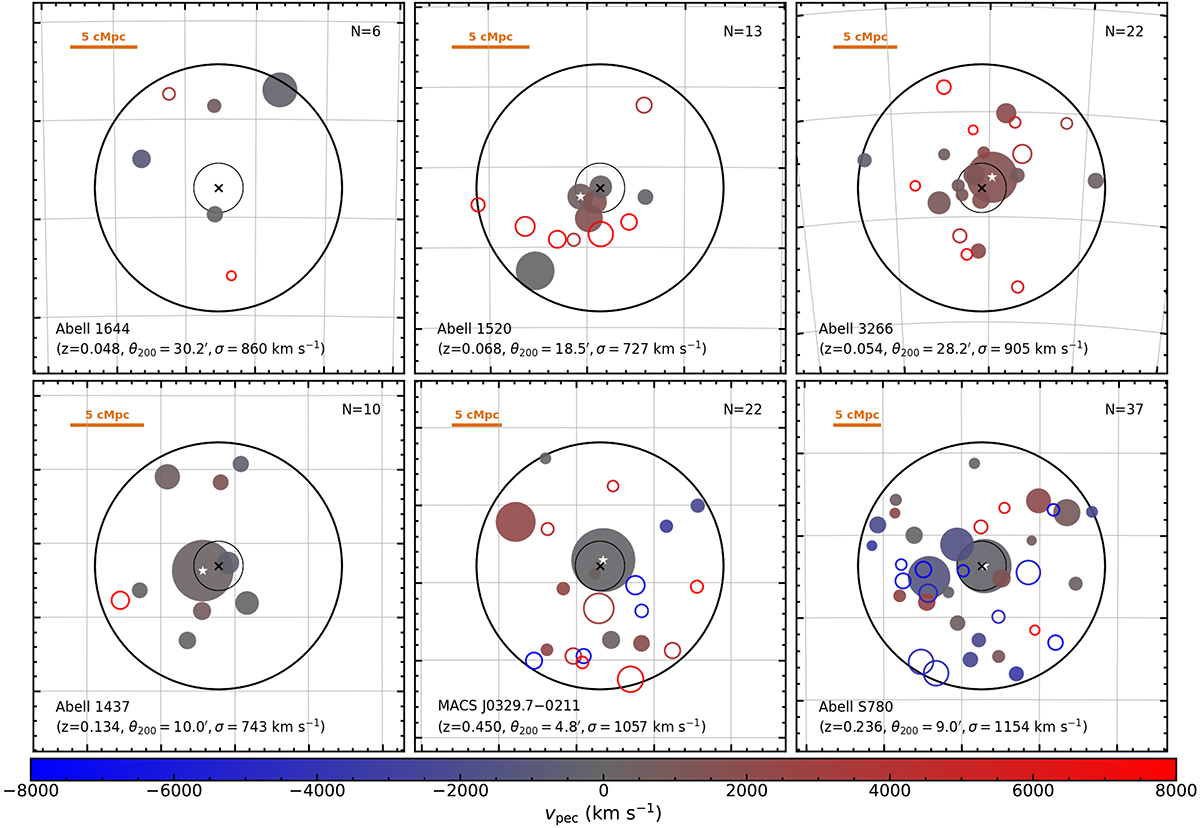
Infalling structures in example CHANCES Low-z (top) and Evolution (bottom) clusters as traced by associations of red galaxies identified with redMaPPer within 8000 km s−1 of the nominal redshift of each CHANCES cluster. The filled circles correspond to redMaPPer groups with velocities within three times the CHANCES velocity dispersion. For each subsurvey, we show a cluster with a small (left), typical (middle), and large (right) number of redMaPPer groups around them. The concentric black cross and empty thin and thick circles mark the centre of each CHANCES cluster, r200, and 5r200, respectively. The coloured circle sizes correspond to the r200 of each group based on its richness. The colour scale shows the peculiar velocity with respect to the main cluster. When present, the redMaPPer system associated with the main CHANCES cluster is shown with a white star. In the bottom of each panel, we list the redshift, angular size corresponding to r200, and richness-derived velocity dispersion of each cluster. The numbers in the top right corners correspond to the number of redMaPPer groups, and the orange bars in the top left corners indicate 5 comoving Mpc at the redshift of each cluster.
Current usage metrics show cumulative count of Article Views (full-text article views including HTML views, PDF and ePub downloads, according to the available data) and Abstracts Views on Vision4Press platform.
Data correspond to usage on the plateform after 2015. The current usage metrics is available 48-96 hours after online publication and is updated daily on week days.
Initial download of the metrics may take a while.


