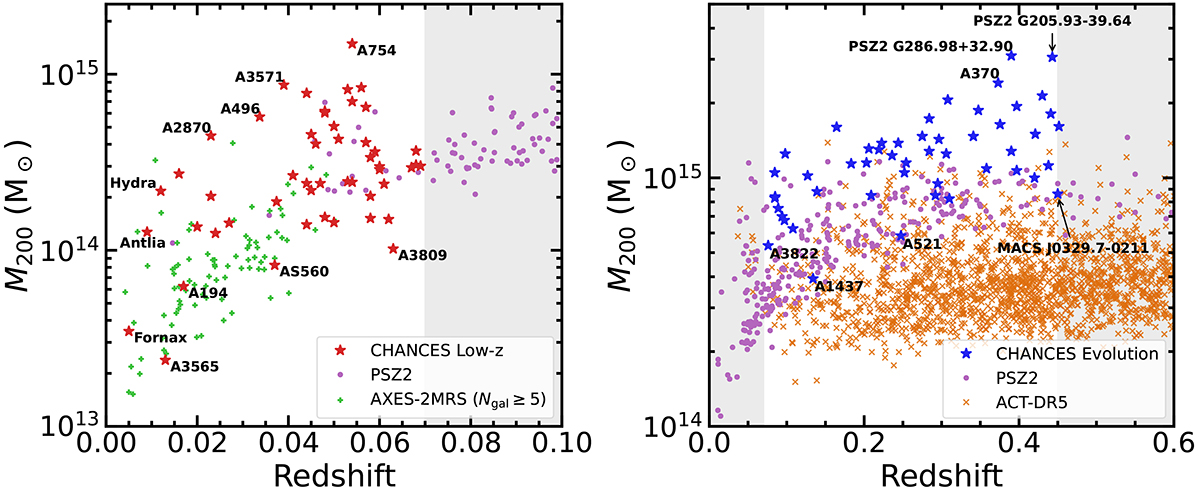
Fig. 3.
Download original image
CHANCES cluster samples (stars) in context. Left: Low-z subsurvey, excluding clusters in the Shapley and Horologium-Reticulum superclusters, compared with southern (Dec < +5°) clusters in AXES-2MRS (with at least five spectroscopic members) and PSZ2, also excluding clusters in the supercluster regions. Right: Evolution subsurvey, compared with southern clusters in PSZ2 and ACT-DR5. In both cases, we removed duplicate clusters by only keeping the higher-priority mass estimate (see Sect. 3), and we removed clusters with Galactic latitudes |b|< 20°. We give the names of the least and most massive clusters in each sample, as well as the names of some well-known clusters. In the right panel, we also highlight MACS J0329.7−0211, which is the only Evolution cluster that is not in PSZ2. The redshift range of each CHANCES subsurvey is shown with the white background. The CHANCES cluster masses correspond to those listed in Tables A.1 and A.2.
Current usage metrics show cumulative count of Article Views (full-text article views including HTML views, PDF and ePub downloads, according to the available data) and Abstracts Views on Vision4Press platform.
Data correspond to usage on the plateform after 2015. The current usage metrics is available 48-96 hours after online publication and is updated daily on week days.
Initial download of the metrics may take a while.