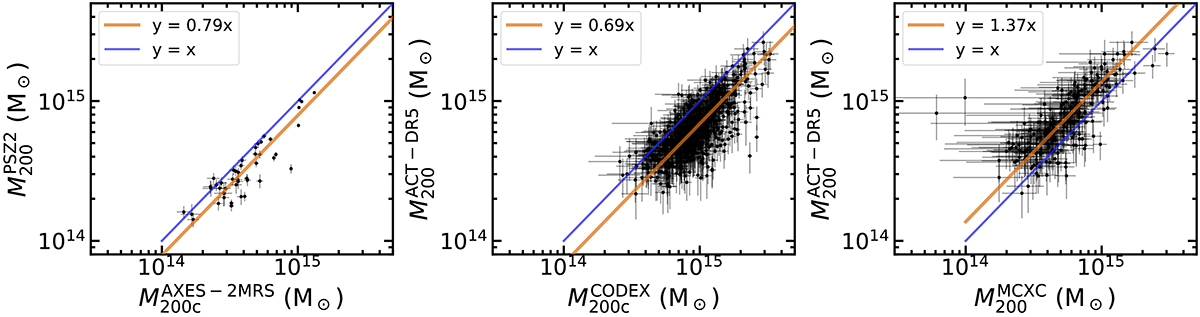
Fig. 2.
Download original image
Mass comparison examples. From left to right, we compare the mass estimates of PSZ2 to AXES-2MRS, ACT-DR5 to CODEX, and ACT-DR5 to MCXC. The points with error bars show all clusters in common between each pair of catalogues, regardless of whether they are part of CHANCES. Thin blue lines show y = x, and the thick orange lines show the maximum-likelihood estimates given in the legends. The extremely small uncertainties in PSZ2 and AXES-2MRS only consider statistical uncertainties. We account for this fact by including an intrinsic scatter term in the fits. These fits correspond to the adopted normalisations discussed in Sect. 3 and listed in Tables 1 and 2.
Current usage metrics show cumulative count of Article Views (full-text article views including HTML views, PDF and ePub downloads, according to the available data) and Abstracts Views on Vision4Press platform.
Data correspond to usage on the plateform after 2015. The current usage metrics is available 48-96 hours after online publication and is updated daily on week days.
Initial download of the metrics may take a while.