Fig. 1.
Download original image
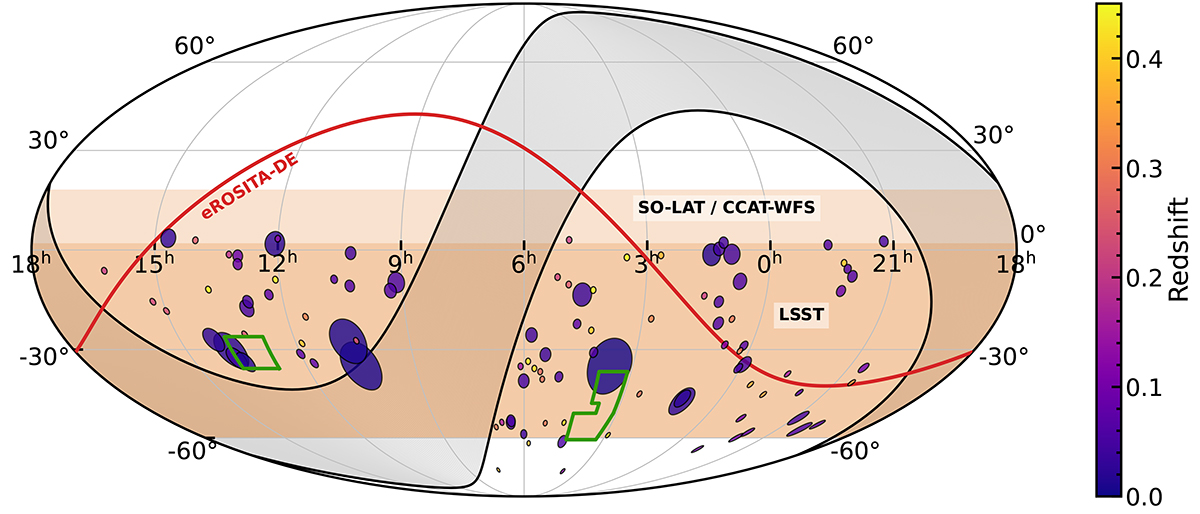
Sky distribution of CHANCES clusters in equatorial coordinates in a Mollweide projection. The radius of each circle corresponds to the maximum between 5r200 and 1 deg (the latter set for visibility) and is colour-coded by redshift. The supercluster regions are shown with green polygons. The region below the red curve corresponds to the eROSITA-DE survey, the dark orange region shows the approximate LSST survey area, and the light orange region shows SO-LAT and CCAT-WFS (for simplicity, we draw both as delimited by −60° ≤δ ≤ +18°). The grey band bounded by black lines shows Galactic latitudes |b|≤20°.
Current usage metrics show cumulative count of Article Views (full-text article views including HTML views, PDF and ePub downloads, according to the available data) and Abstracts Views on Vision4Press platform.
Data correspond to usage on the plateform after 2015. The current usage metrics is available 48-96 hours after online publication and is updated daily on week days.
Initial download of the metrics may take a while.