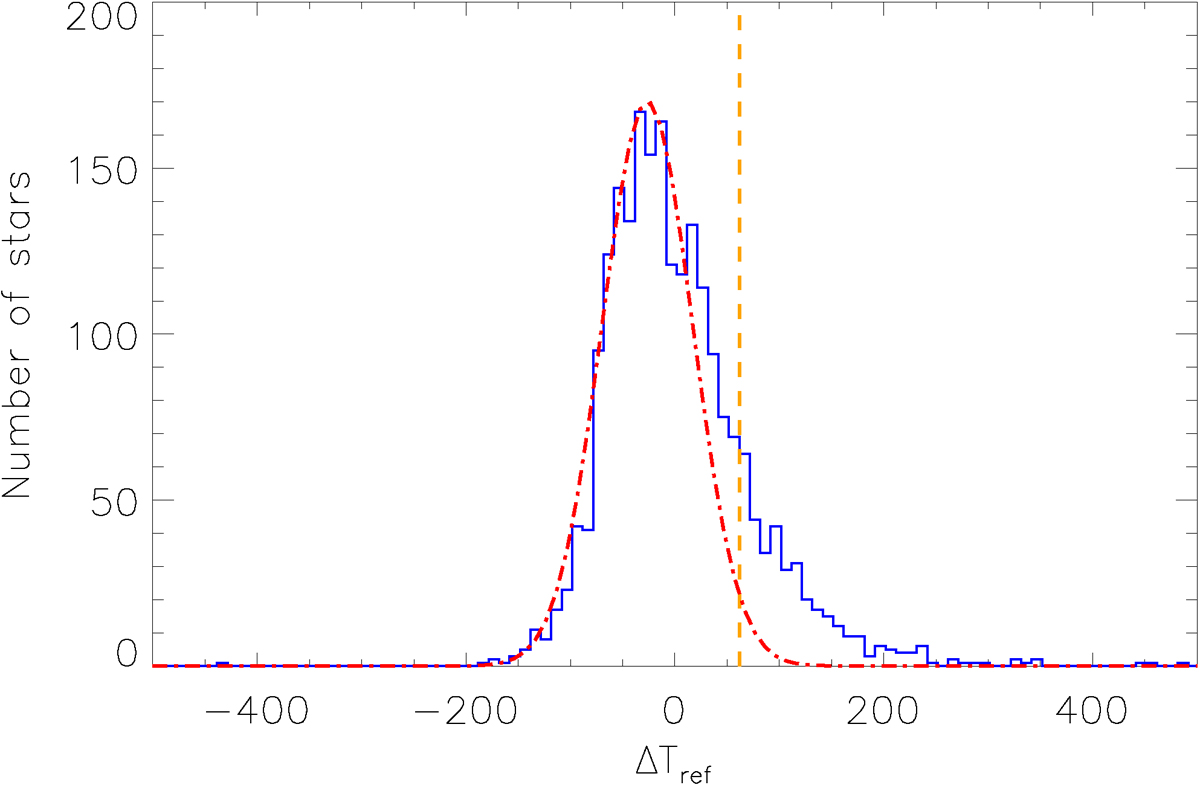
Fig. 9.
Download original image
Distribution of stars identified as RGB or AGB, with log(g) < 2.2 (stars above the main RC population in a Kiel diagram) as a function of ΔTref (in blue). The dot-dashed red line shows a Gaussian fit of width 44.04 K centered on −26.40 following the distribution of α-rich stars. The orange dashed line indicates the two-σ limit of the measured RGB sample distribution following Section 5.
Current usage metrics show cumulative count of Article Views (full-text article views including HTML views, PDF and ePub downloads, according to the available data) and Abstracts Views on Vision4Press platform.
Data correspond to usage on the plateform after 2015. The current usage metrics is available 48-96 hours after online publication and is updated daily on week days.
Initial download of the metrics may take a while.