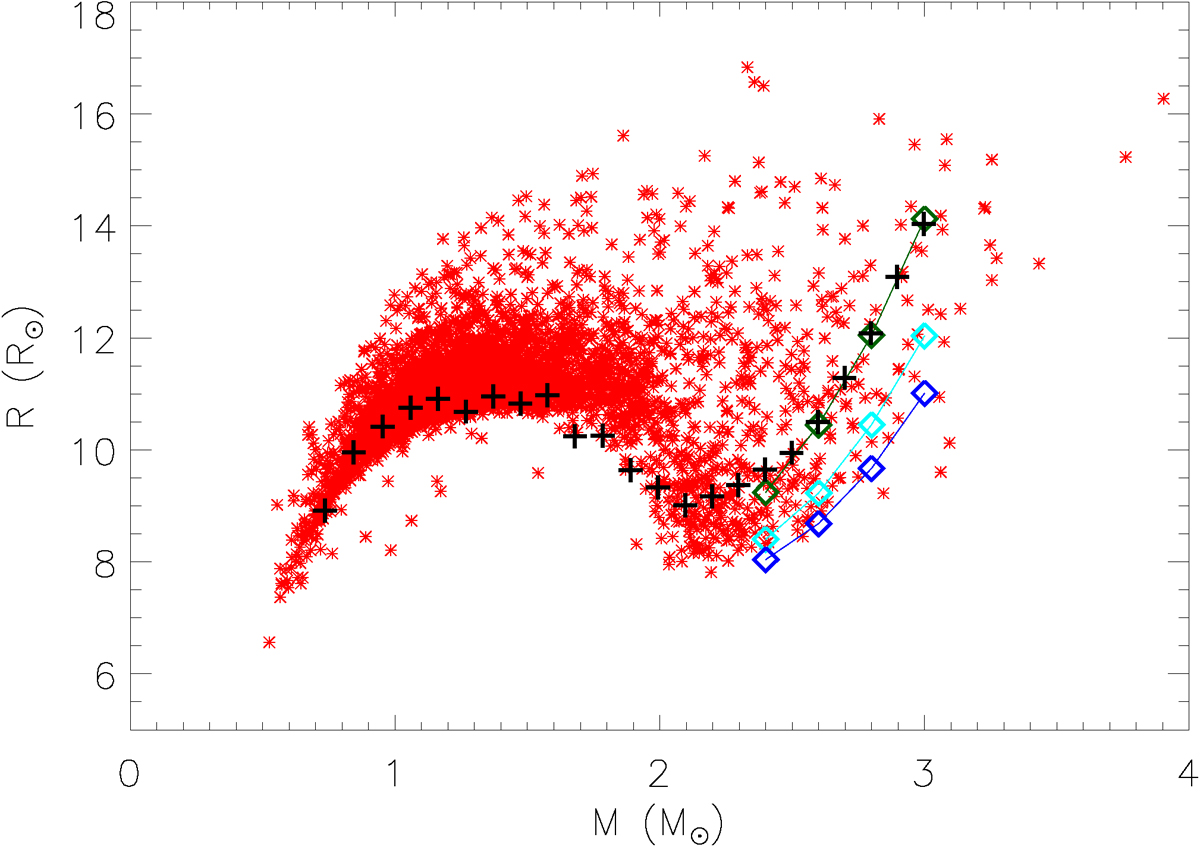
Fig. 7.
Download original image
Seismic radius as a function of seismic mass for stars identified as RC following Section 4. The maximum log(g) values of the RC for the different YREC models are represented by the diamonds. The colors depict models with different core overshooting values: no overshooting (dark green), 0.1 pressure scale height (cyan), and 0.2 pressure scale height (dark blue). The minimum radius values for the different MIST tracks are shown as black crosses.
Current usage metrics show cumulative count of Article Views (full-text article views including HTML views, PDF and ePub downloads, according to the available data) and Abstracts Views on Vision4Press platform.
Data correspond to usage on the plateform after 2015. The current usage metrics is available 48-96 hours after online publication and is updated daily on week days.
Initial download of the metrics may take a while.