Fig. 6.
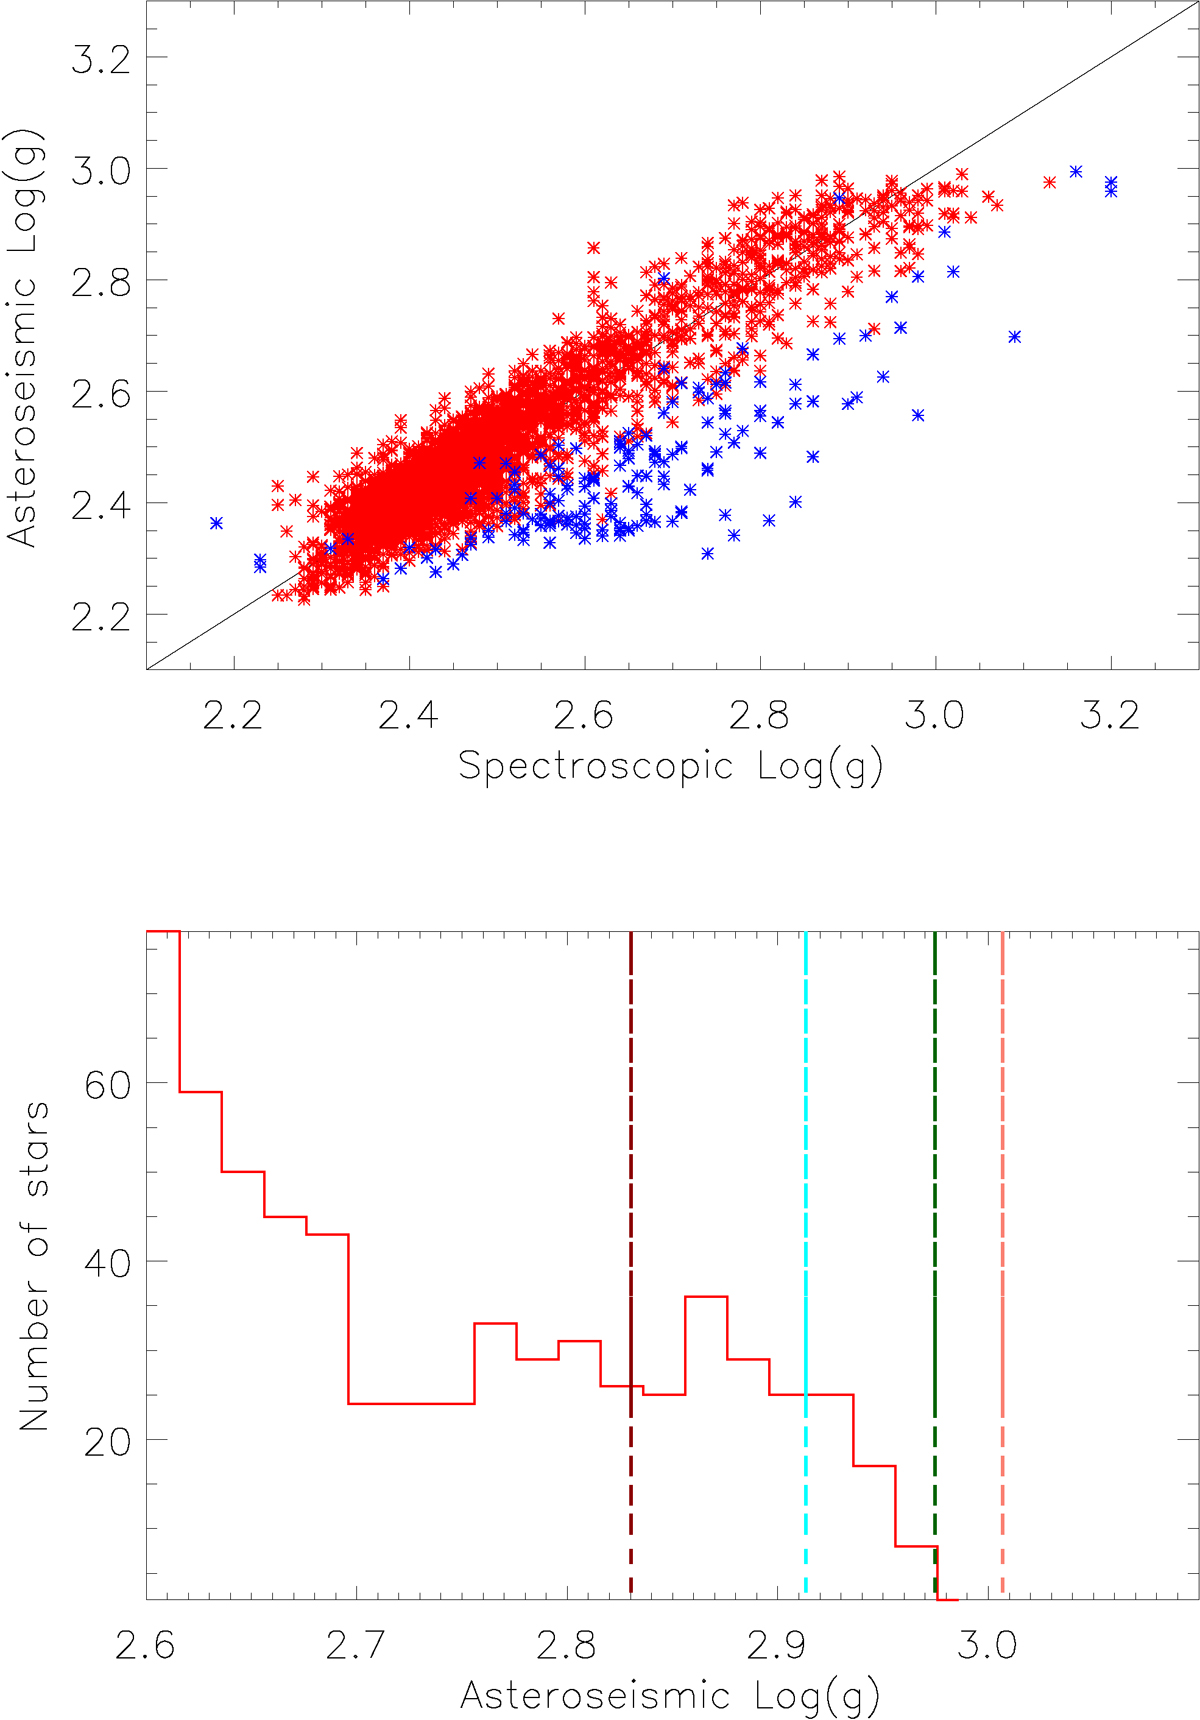
Download original image
Top: Seismic surface gravity (g) for the stars identified by seismology as belonging to the RC (in red) as a function of the spectroscopic surface gravity. The blue points correspond to the stars identified as RGB by spectroscopy on the contrary to seismic results. Bottom: Seismic surface gravity for the same sample of seismic RC stars, focused on the bottom of the RC. The dashed lines correspond to the maximum values for secondary clump YREC models, with a core overshoot of 0.2 pressure scale height: dark red, cyan, dark green, and pink correspond respectively to stellar models with masses of 3.0, 2.8, 2.6, and 2.4 M⊙.
Current usage metrics show cumulative count of Article Views (full-text article views including HTML views, PDF and ePub downloads, according to the available data) and Abstracts Views on Vision4Press platform.
Data correspond to usage on the plateform after 2015. The current usage metrics is available 48-96 hours after online publication and is updated daily on week days.
Initial download of the metrics may take a while.